Last summer, we wrote a blog post about opportunities for Safe Routes to School programs to get involved in Safe Streets for All projects.
Resource Library
This guest blog post is written by Noah Lenstra, Associate Professor of Library and Information Science at the University of North Carolina Greensboro (njlenstr@uncg.edu
Key takeaways:
- This study of one U.S. city (College Station, Texas) found that most students commute to/from school by personal vehicle. Findings are established for the number of days per week and mode of travel, broken down for both walking and biking, and separated by gender. In this community, 39 percent of children walk at least once per week, and 23 percent bike. Boys are significantly more likely to bike than girls.
- More children walked home from school (38 percent) than to school (19 percent)
- Children who walked to school at least once per week tended to live on a grid street rather than a cul-de-sac and lived closer to school. This was also true for children biking to school.
- Children were more likely to walk to school if there were more mature trees and shrubs, but not necessarily bike lanes present. Children were more likely to bike if there were fewer intersections to cross.
- Children whose parents were more concerned about crime, traffic volume, traffic speed, a lack of sidewalks/bikeways, and lack of separation between traffic and sidewalks/bikeways were less likely to walk or bike to school.
- Children were also less likely to walk if convenience was an issue which included factors such as distance, not enough time, after-school schedule, convenience, and child’s unwillingness.
- The average walking street distance was 0.71 miles, while the average biking distance was about 0.93 miles. For children who rode to school, the average car distance was 1.08 miles, while the mean bus distance was 1.44 miles.
- Schools located centrally within the school walk zone versus those on the edge of a walk zone show higher numbers of walking and biking. A school walk zone in Texas is the two-mile area around the school where bus transportation.
Happy new year! January 3rd marked the start of the 118th Congress, and we are enthusiastic about our ongoing work to keep Safe Routes to School relevant and prioritized in federal policy. As we shared last month, the majority of our legislative priorities were included in the 2021 Bipartisan Infrastructure Law, so this year, we are working toward the following:
The start of a new year is an inspiring time. We embrace this moment as a fresh start, setting ambitious resolutions to adopt positive or healthy habits in our everyday lives. We hope these changes will eventually lead us to become healthier, happier, or kinder individuals. With enthusiasm and gusto, we take significant leaps to realize our newfound commitments.
Key takeaways:
- This systematic review examined 65 studies to understand factors that impact active school travel. Active travel to school is the language used in this international study, and is the same as active transportation to school, namely walking and bicycling.
- The primary factors that emerged as impacting active transportation to school were perceptions of traffic safety and perceptions of neighborhood safety. The focus was on parents and caregivers as the decision-makers regarding the mode of travel to school.
- Perceptions of traffic safety varied based on road type, traffic volume, traffic speed, and intersection density. However, in all cases, the presence of a footpath improved perceptions of safety. Separation from traffic, with trees as a buffer, further increased the likelihood of walking and bicycling.
- Perceptions of neighborhood safety focused on aesthetics and maintenance. Run-down, littered neighborhoods with poor lighting are perceived as inviting crime (whether or not this is the reality). Whereas well-maintained, walkable neighborhoods were perceived as safe. Relatedly, more buildings with windows facing the street contributed to improved perceptions of safety due to the idea that more eyes are on the street.
- Distance between home and school was also a factor. Like other studies, this research shows that shorter distances encourage increased walking and bicycling.
Key takeaways:
- This study provides a comprehensive list of high-level, anti-displacement strategies and resources to support building healthy communities. This menu of strategies was produced in part to support public health practitioners helping communities advance healthy community design projects.
- Improvements in low-income communities to address walkability and improve access to parks and transit may lead to higher property costs and increased housing costs, displacing existing residents who do not reap the benefits of healthy community design.
- This article identifies 141 strategies for mitigating and preventing displacement. Strategies were grouped by the following topology: preservation, protection, inclusion, revenue generation, incentives/disincentives, property acquisition, stabilization of resources, community engagement/education, and cross-cutting policies that require cross-agency coordination.
- A single strategy alone is unlikely to prevent displacement. Rather, a combination of multiple strategies is required to ensure that residents can benefit from community investments that improve community health while assuring that they are not displaced because of these neighborhood improvements.
Community engagement and education is one of the categories of strategies. This strategy includes engaging low-income and communities of color in community planning processes and ensuring resident representation and participation. It also includes increasing knowledge about displacement and providing education on land use planning and policy-making to equip local residents and youth with how to influence those changes in their own
On Tuesday, January 24th from 11 am to noon Mountain, the Colorado Department of Transportation is hosting a free webinar presented by the Safe Routes Partnership.
Key takeaways:
- This study seeks to reframe the narrative around transportation accessibility as a form of epistemic justice, valuing the knowledge of low-income people of color, as well as the diversity of knowledge they hold.
- “Lived expertise” or lived experience, the researchers argue, should be valued as part of a holistic understanding of transportation accessibility.
- Quantitative data – such as which demographic groups walk, bike, drive, and use public transportation - and technical language about the condition (or existence) of roads, sidewalks, bike lanes, and transit often takes the spotlight from individuals and groups who live in neighborhoods being studied for transportation research.
- Framing transportation inequities solely on quantitative data detracts from the lived experience of a neighborhood – access to a car, cost of travel, proximity or structure of the transportation system, and physical limitations or disabilities.
- Perception is a factor that cannot be quantified. Lived experiences tell the story of harassment, fear for personal safety, fear of certain public spaces, interactions with police, and social judgment.
- Generating local knowledge derived from lived experiences of low-income people of color requires talking and, more importantly, listening.
With the Georgia Senate runoff results decided on December 6, 2022, the mid-term election officially comes to a close, and we can take stock of what it means for walking, bicycling, and Safe Routes to School in this upcoming Congress.
Key takeaways:
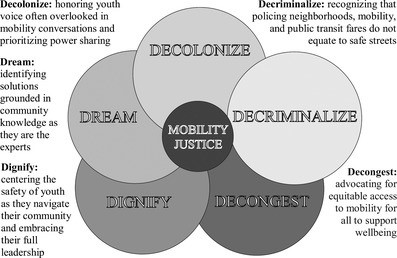
- Using the mobility justice framework means recognizing the challenges and inequities that low-income youth of color face (particularly regarding active transportation) and integrating their knowledge into the transportation decision-making process.
- This study employed community-based participatory research, specifically photovoice, which uses photography and storytelling to set priorities and advocate for change. Through a series of sessions, the five domains known as the 5 D’s of the Mobility Justice
- The 5 D’s of Mobility Justice for Youth have been adapted from the mobility justice conceptual framework model from People for Mobility Justice.

- Providing free transit was one policy solution identified to reduce inequitable access to public transportation. This policy has received pushback due to unproven, non-materialized fears that such a policy would lead to an increase in problematic passengers, that would dissuade ridership.
- Youth in this study also recommended well-lit, connected sidewalks, leading to public transportation, green spaces, and community hubs, to increase perceptions of safety and comfort with neighborhood mobility.
On Wednesday, December 14th from 11 am to noon Mountain, the Colorado Department of Transportation is hosting a free webinar presented by the Safe Routes Partnership.
Last month, the Southern California Association of Governments (SCAG) concluded its 2022 Go Human Mini-Grants Program, which funded 26 safety and engagement projects a
Key takeaways:
- A community concern of “tactical urbanism” - low-cost, temporary changes to streets and roadways to increase safety, especially for people walking and biking – is that such changes increase traffic congestion and negatively impact local businesses. The findings of this case study indicate otherwise and that rather than increasing traffic, tactical urbanism contributes to “traffic evaporation” – a decrease in traffic flow following a decrease in road space.
- The study measured the relative changes in traffic following the implementation of multiple tactical urbanism interventions on eleven streets in Barcelona, Spain, during the COVID-19 pandemic.
- Four areas were studied: intervention streets (directly impacted by changes), adjacent streets (parallel to where changes took place), buffer streets (within 1/3 mile of where changes took place), and control streets (greater than 1/3 mile from where changes took place). Following the changes, traffic decreased significantly on the intervention streets, without a corresponding increase in the other three areas.
November 2022 marks the first anniversary of the Bipartisan Infrastructure Law, and we are celebrating by unveiling our new Transportation Alternatives Program tracking tool!
Every quarter, we look at how state departments of transportation (DOTs) are getting Transportation Alternatives Program money out the door so that it can build biking and walking infrastructure and support Safe Routes to School programs. Here’s the scoop on what we track and why it matters for state and local bicycle, pedestrian, and Safe Routes to School advocates updated to account for changes to the program in the Bipartisan Infrastructure Law.
In 1969, the Nixon Administration hosted the first ever White House Conference on Hunger, and it resulted in the creation of the school lunch program and the Special Supplemental Nutrition Assistance Program for Women, Infants, and Children (WIC). In September 2022, the Biden-Harris Administration held the first White House Conference on Hunger since that initial conference over fifty years ago and established ambitious, yet attainable goals.
On Wednesday, November 30th from 11 am to noon Mountain, the Colorado Department of Transportation is hosting a free webinar presented by the Safe Routes Partnership.
Federal funding for local park, trail, and active transportation projects can be transformative for a community! This fact sheet profiles several
federal funding sources that have the potential to support infrastructure improvements that increase access to everyday destinations, especially parks and greenspace.

