This blog was written by Amy Johnson, GIS Intern, and Portland Community College student.

This resource provides recommendations for how champions and stakeholders who care about their state’s support for active transportation and physical activity, can emphasize new opportunities within the Bipartisan Infrastructure Law to influence decision-makers in their state to strengthen state policies and practices for improving walking and rolling and raise their state report card scores.
This blog was written by Amy Johnson, GIS Intern, and Portland Community College student.

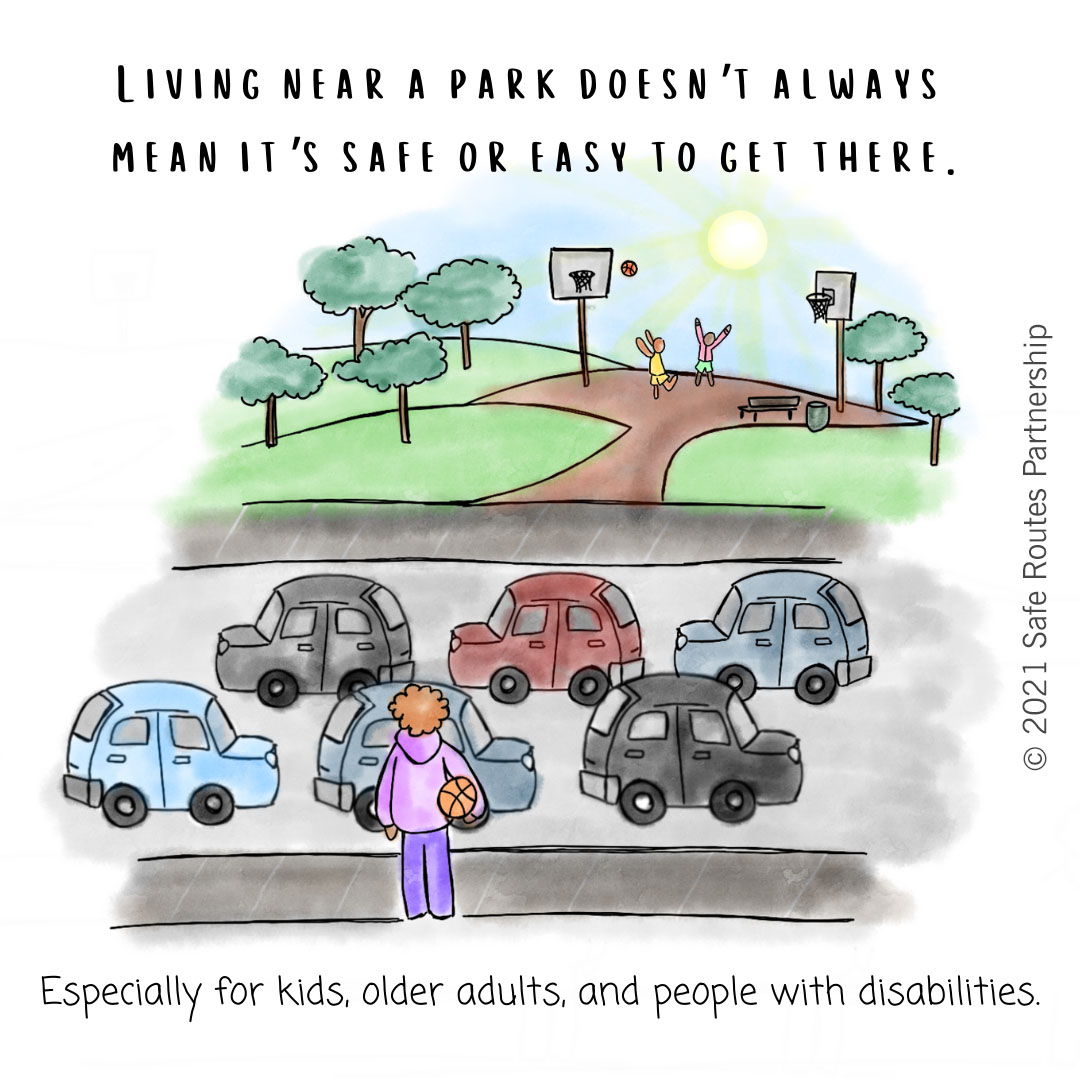
Thinking of my childhood trips to the park brings me right back to the feeling of the sun on my face and summer days when all I was worried about was not missing the neighborhood ice cream truck. As a kid, I would go to several nearby parks with my grandparents after school or on weekends on foot, bicycle, or skates. Living in Queens, New York meant I had sidewalks to walk or roll, and depending on the destination of my park of choice, a few high-traffic intersections that required the assistance of a guardian.
Young people are interested in safe walking, biking, rolling, riding, and driving. Talking with teens about their travel habits reveals two competing priorities: teens’ desires to be independent and their parent's and caregivers’ desires to keep them safe. This guide spotlights youth-led traffic safety projects from across the country and offers strategies for how Safe Routes practitioners can champion youth-led safety projects like Safe Routes to School and advocacy campaigns.
We are pleased to announce our next California webinar on Wednesday, May 31st at 11 am: USDOT’s Safe Streets for All Program - Opportunities for California Communities! This webinar will serve as an introduction to Safe Streets for All (SS4A), a new federal program created by 2021’s Bipartisan Infrastructure Law. SS4A offers both Planning and Demonstration Grants, and Implementation Grants: the former can set up your community well for the latter, or an Active Transportation Program infrastructure project.
Wednesday, May 10th from 2 - 3 pm ET
Did you hear the news? High schools are now eligible for federal Safe Routes to School funding! This means new possibilities for connecting Safe Routes to issues teens care about, from climate justice to distracted driving to digital media. Join us as we explore best practices for working with high school students. Learn about building trust, getting program buy-in, and giving teens what they need to lead their own projects. Plus, we will share some inspiring youth-led projects from across the country!
Key takeaways:
Thursday, May 11th from 11am-12pm PT
Featuring speakers from Oregon State Parks, Safe Routes Partnership, and Oregon Department of Transportation, this webinar will highlight state and federal funding opportunities communities and organizations can use to improve safe, convenient, and equitable access to parks and other essential community destinations.
Key takeaways:
Tuesday, April 25th from 11 am - 12 pm MT
From research and evaluation to curriculum design and GIS mapping, academic institutions can offer a number of valuable resources to Safe Routes to School programs. And the best part is, they want to get involved! Join us as we explore how college and university partnerships can increase your program capacity and turn innovative ideas into action.
Wednesday, April 19th at 2-3 pm ET
The days are longer, the weather is warmer, and National Bike Month is just around the corner! Let’s get ready for Spring programming by gathering virtually to discuss what’s going on in the world of Safe Routes to School. Join us for an informal Zoom session to connect with other Safe Routes to School practitioners. Share your program successes and challenges, swap resources, brainstorm project ideas, and let us know how the Partnership can support your work going forward.
Wednesday, March 15th from 3pm-4pm ET
Nonprofits are allowed to do electoral activities- like candidate surveys and forums, but there are some rules around it.
While we await the President’s budget and meet with members of Congress on our appropriations requests, it is a nice time of year to check-in on how states are doing implementing the Transportation Alternatives Program.
Key takeaways:
Key takeaways:
A new infobrief, Keep Calm and Carry On to School: Improving Arrival and Dismissal for Walking and Biking, provides information on how schools, districts, cities, counties, and community partners can address arrival and dismissal in school travel plans as well as other planning, policy, and programming efforts.
Wednesday, March 15th from 2pm-3pm ET
It’s the best of times. It’s the worst of times. That’s right, we’re talking about school arrival and dismissal! Join us as we discuss how to tackle these tricky times of the day. We’ll explore arrival/dismissal observation protocols, school street activations, demonstration projects, and creative ideas to encourage more walking and rolling.
Wednesday, March 8th from 11 am - 12 pm MT
Safe Routes to School programs are a team effort. Learn how Safe Routes practitioners and partners in Durango are working together to improve safety and encourage more walking and rolling. We will share best practices for communicating with school districts, connecting with community-based organizations, and engaging older students in Safe Routes projects.