We’ve developed state report cards which provide a snapshot of how supportive each state is of walking, bicycling, and physical activity for children and adults as of 2018.
The report cards primarily look at state policy, focusing on four key areas: Complete Streets and Active Transportation, Safe Routes to School and Active Transportation Funding, Active Neighborhoods and Schools, and State Physical Activity Planning and Support.
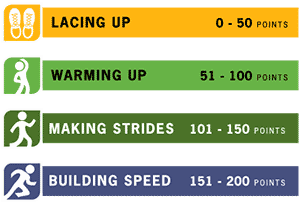
The full report includes a detailed explanation of how the states were graded. Download a quick guide to understanding the report card scores and grading and a fact sheet on how to use your state report card.
The maps below show grades and information about key indicators for each state. Click on the map to view each state's report card.
Change in Active Transportation Funding Grade | Transportation Alternatives Program Funding Transfers | SRTS and Non-Infrastructure Funding | High Need Communities | School Siting | Physical Education Requirements | Appendices

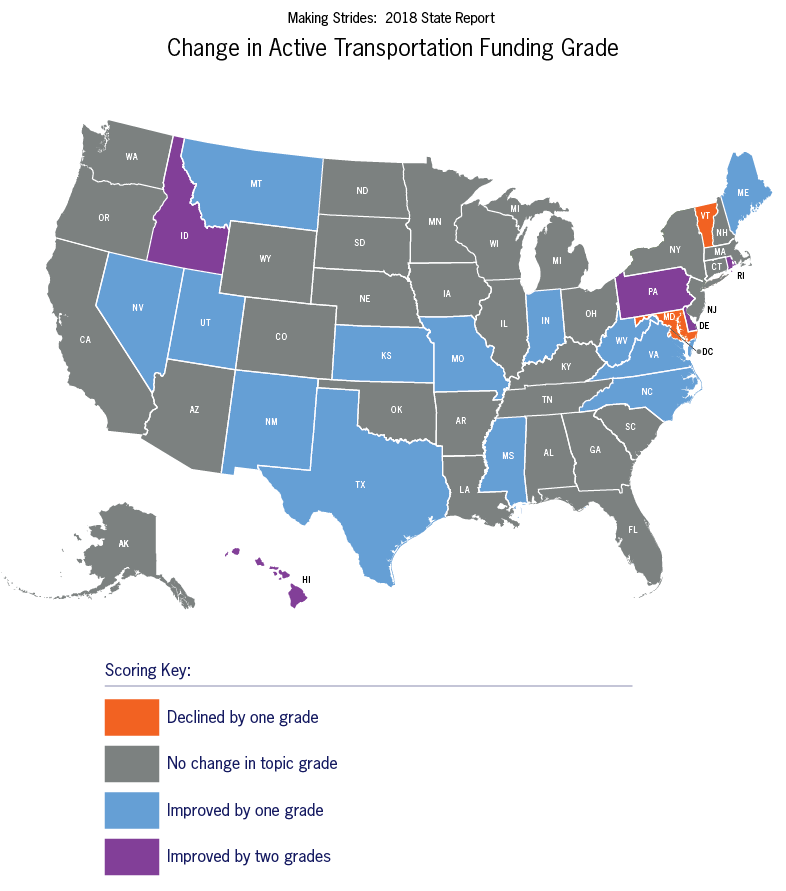
This map (figure 1 in the report) shows the change in states’ scores from 2016 to 2018 in the core topic area of Safe Routes to School and Active Transportation Funding. Most states’ scores remained the same, a number of states improved by one grade, and a few states declined by a grade or increased by two grades.

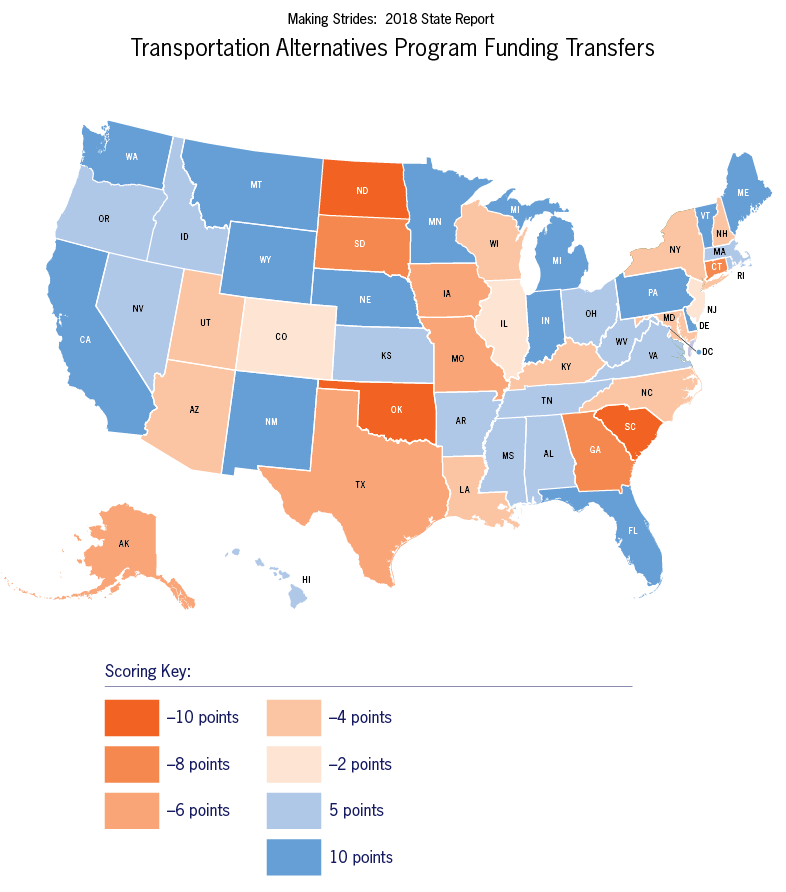
This map (figure 2 in the report) shows how states are doing in terms of amount of money transferred out of the federal Transportation Alternatives Program (TAP) funding received. States that received 10 points have not transferred or allowed to lapse any TAP funding. States lost 2 points if they transferred or let lapse 10-20% of funding up to a maximum of 10 points lost for states that transferred or let lapse 50% of their TAP funding.

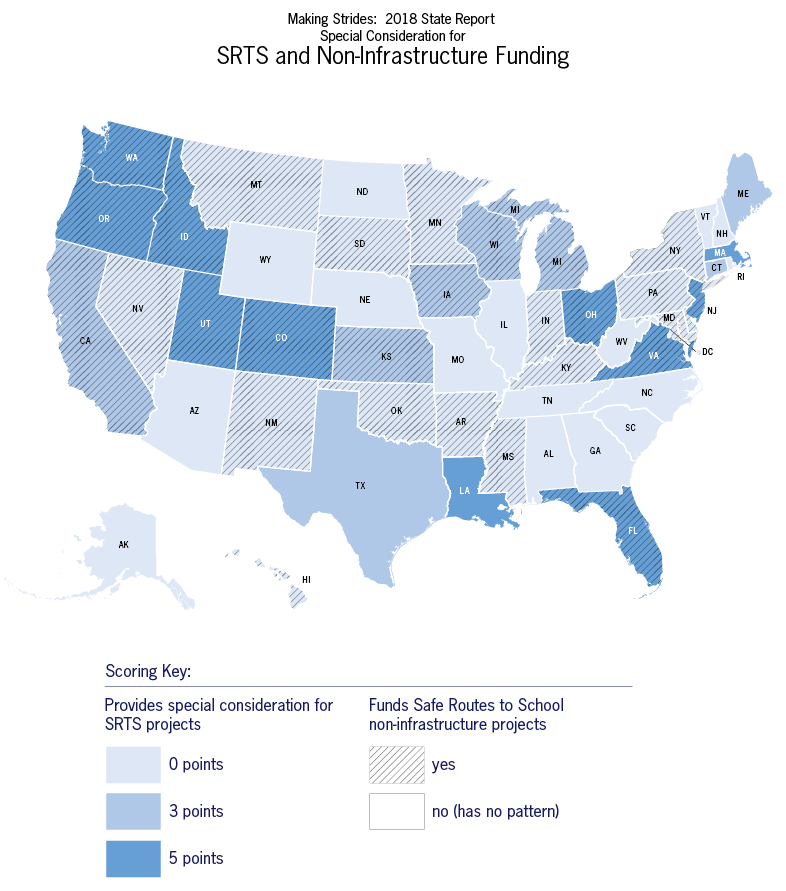
This map (figure 3 in the report) summarizes states’ performance on two related indicators involving Safe Routes to School funding: darker shades of blue indicate that states provide special considerations for Safe Routes to School projects in allocating their TAP funding; hatch marks are used to indicate states that allow TAP funding to be used for Safe Routes to School non-infrastructure projects (education and encouragement programs), and solid shades show where funds may only be used for infrastructure.

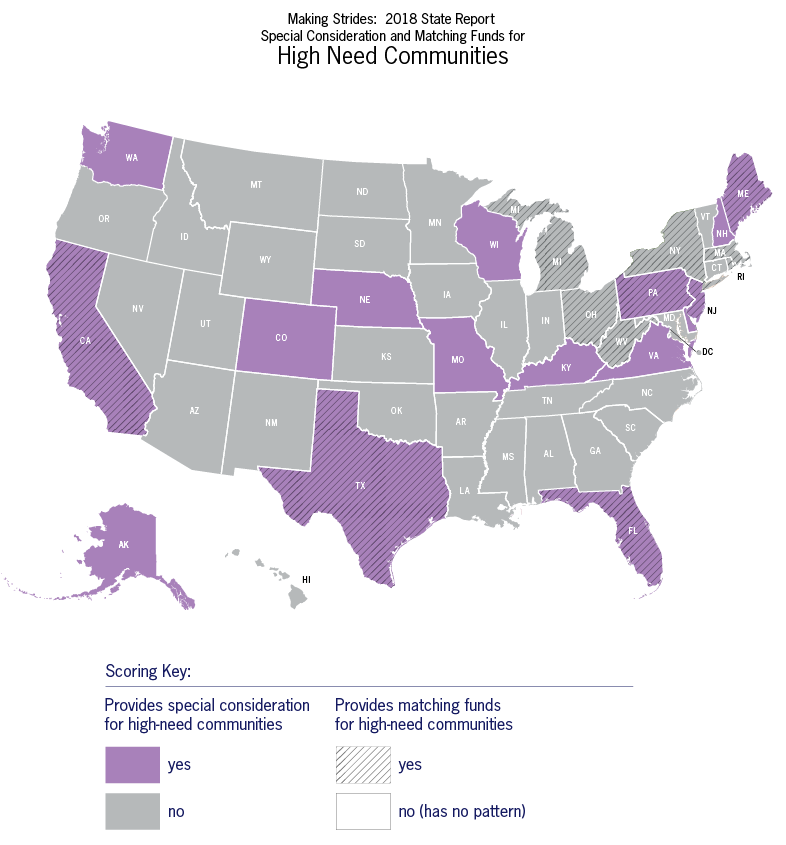
This map (figure 4 in the report) summarizes states’ performance on two related indicators involving funding for high needs communities: the color of the state (purple versus gray) indicates whether special consideration (such as extra points or set aside funding) is provided in TAP fund awards to high needs communities; hatch marks indicate whether the state provides matching funds to help low income communities overcome the financial barrier posed by the match requirement of TAP funding.

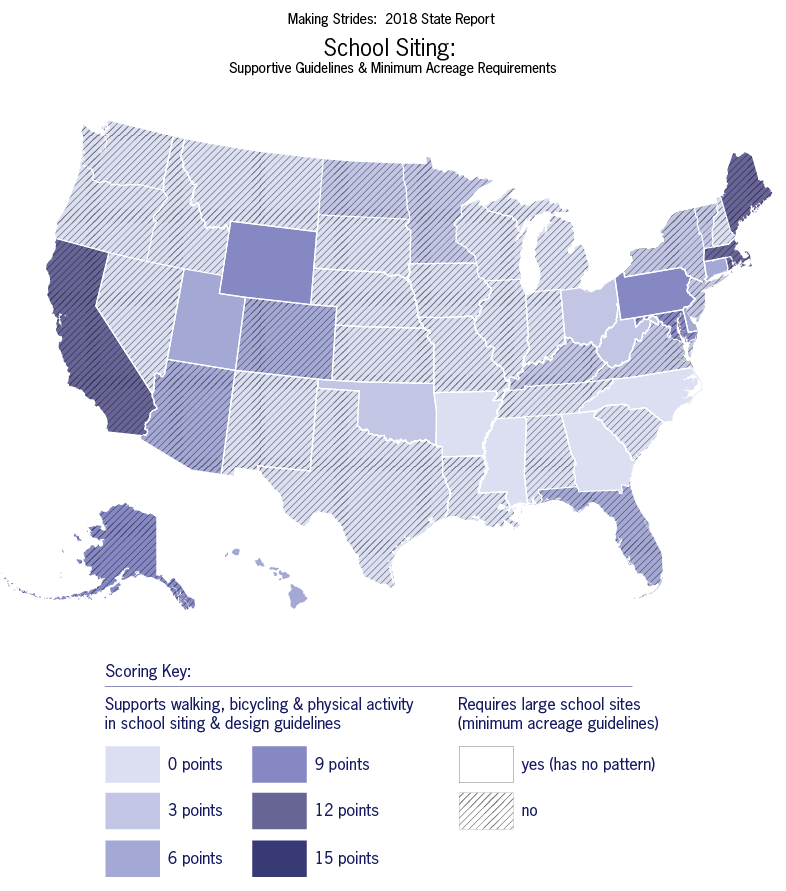
This map (figure 5 in the report) summarizes states’ performance on two related indicators involving school siting guidelines: darker shades show states that encourage school districts to consider a greater number of positive considerations in siting schools; hatch marks show states that have negative guidelines calling for unnecessarily large school sites.

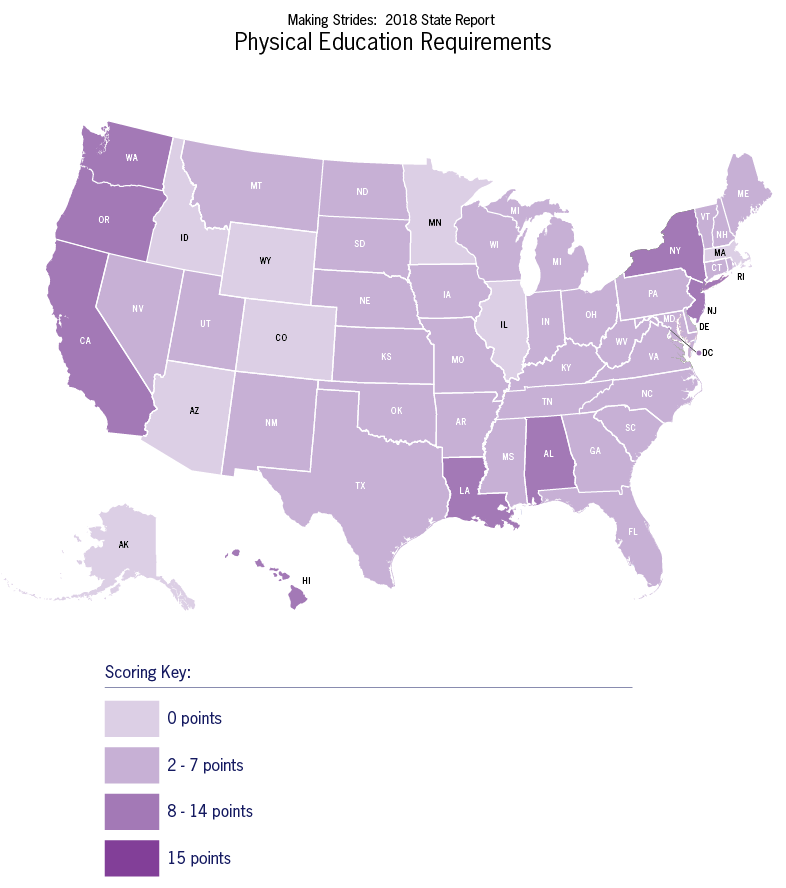
This map (figure 6 in the report) shows how states scored in terms of their physical education requirements, with darker shades indicating states that had stronger requirements for the number of minutes of PE per week as well as PE graduation requirements, and lighter shades showing weaker requirements.


Tables in appendices of the report summarize scoring for each indicator in each of the core topic areas by state. Appendix A summarizes scoring by state for the indicators in the Complete Streets and Active Transportation core topic area. Appendix B summarizes scoring by state for the indicators in the Safe Routes to School and Active Transportation Funding core topic area. Appendix C summarizes scoring by state for the indicators in the Active Neighborhoods and Schools core topic area. Appendix D summarizes scoring by state for the indicators in the State Physical Activity Planning and Support core topic area. Appendix E summarizes the overall scores and grades by state in 2018.
