Now Accepting Session Proposals Until March 4, 2024
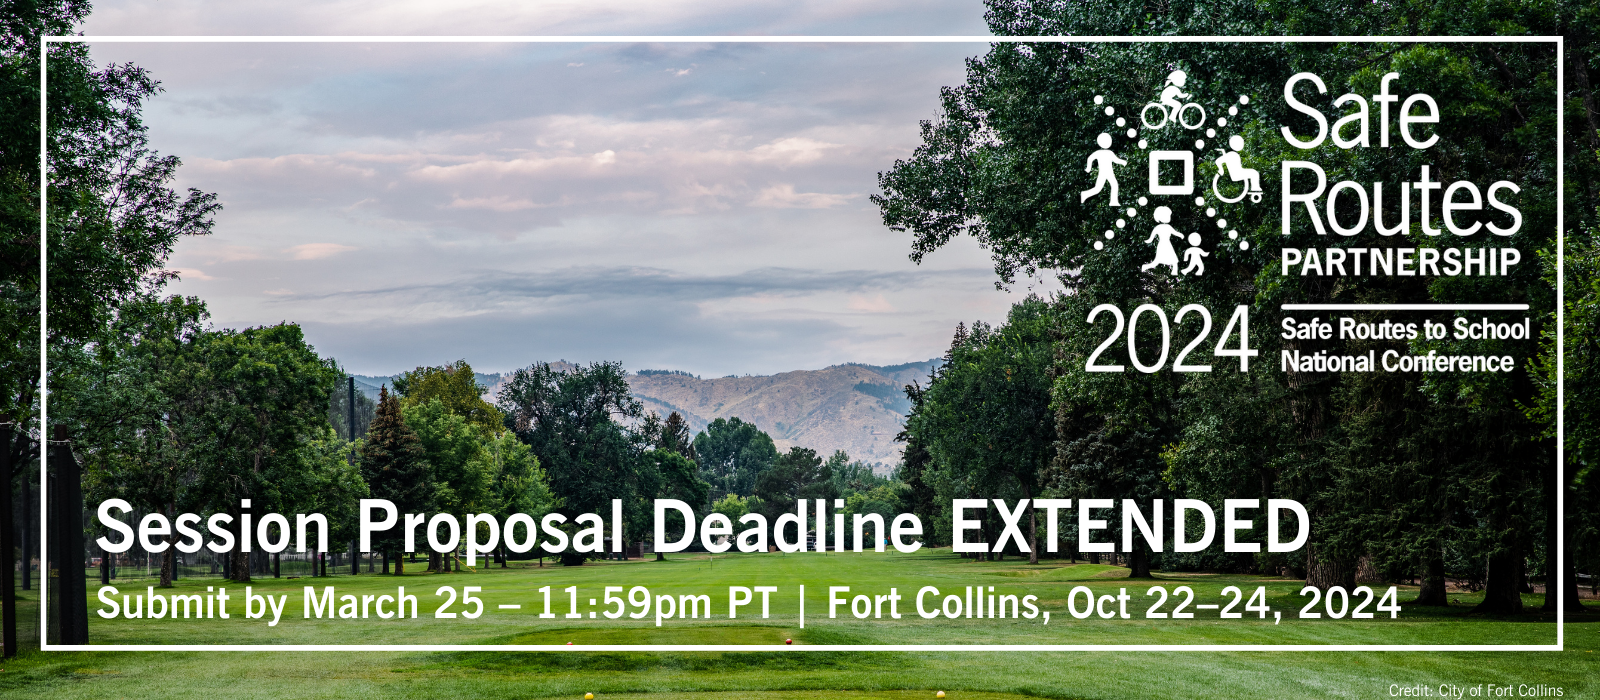
Session Proposal Deadline EXTENDED Until March 25, 2024 11:59pm PT
![]()
![]()
![]()
![]()
![]()
![]()
![]()
![]()
Now Accepting Session Proposals Until March 4, 2024
Session Proposal Deadline EXTENDED Until March 25, 2024 11:59pm PT
Key takeaways:
Key takeaways:
Key takeaway:
Key takeaways:
Key takeaways:
Key Takeaways:
Key Takeaways:
To Get More Kids Walking and Biking, Let’s Inspire, not Shame Communities into Action
State Funding Strategies Workgroup Meeting: The Environmental Legislator Perspective on Active Transportation in 2024
Wednesday, February 7th from 2pm-3pm ET
The Walk, Ride, and Roll Webinar Series is back for 2024! Join us as we explore creative partnerships that support safety and spark joy in Safe Routes programs. Whether you are looking for new outreach venues, evaluation experts, or fun ways to “shake up” your program, this webinar will show you how to find the right partner to fit your needs!
Featured Speakers:
Postponed: January 25th at 3 PM Eastern via Zoom
Even though it’s early January, it feels like Groundhog Day has come early. The third potential government shutdown in five months is looming (January 19th) because Congress has not passed a budget or long-term continuing resolution.
A Community Power Map is a visual tool to help you identify individuals, organizations, or institutions that may influence the outcome of the positive changes to increase park access in your community. This resource was created to guide you in developing your own community power map to build connections and improve park access.
Multimodal trails are off-road routes that can be used for walking and biking. This factsheet outlines ways that states advance equity goals through their multimodal trail programs: typically by defining high-need communities and then prioritizing them in project selection and funding.
November marked two years since the passage of the Bipartisan Infrastructure Law (BIL), and when it comes to how states are implementing the Transportation Alternatives Program (TAP), there is a lot to celebrate! Let’s look back at some of the biggest changes to the program in the Bipartisan Infrastructure Law and how they impacted states’ implementation of TAP.
This tool was developed to support people who are interested in a simple, structured approach to identifying the environmental and mobility-related characteristics of a
place, recording this information, and using this data to inform next steps. This tool was designed to support people who are experts of the place where they live, work,
or play.
We are entering that time of year when our lives get busy. We partake in holiday feasts and plan to connect with loved ones. In the whirlwind of these preparations, I was reminded of the importance of hitting the pause button by a very curious five-year-old whose favorite question is “why?” As I made my grocery lists and mapped out my trips to the various grocery stores, my son asked, “Why do we celebrate Thanksgiving?” A straightforward response is that we use this holiday to give thanks and gratitude.
This guide offers strategies for repealing traffic laws related to walking and biking that are racially enforced for advocates and organizations considering starting policy campaigns.