We’ve developed state report cards which provide a snapshot of how supportive each state is of walking, bicycling, and physical activity for children and adults as of 2020.
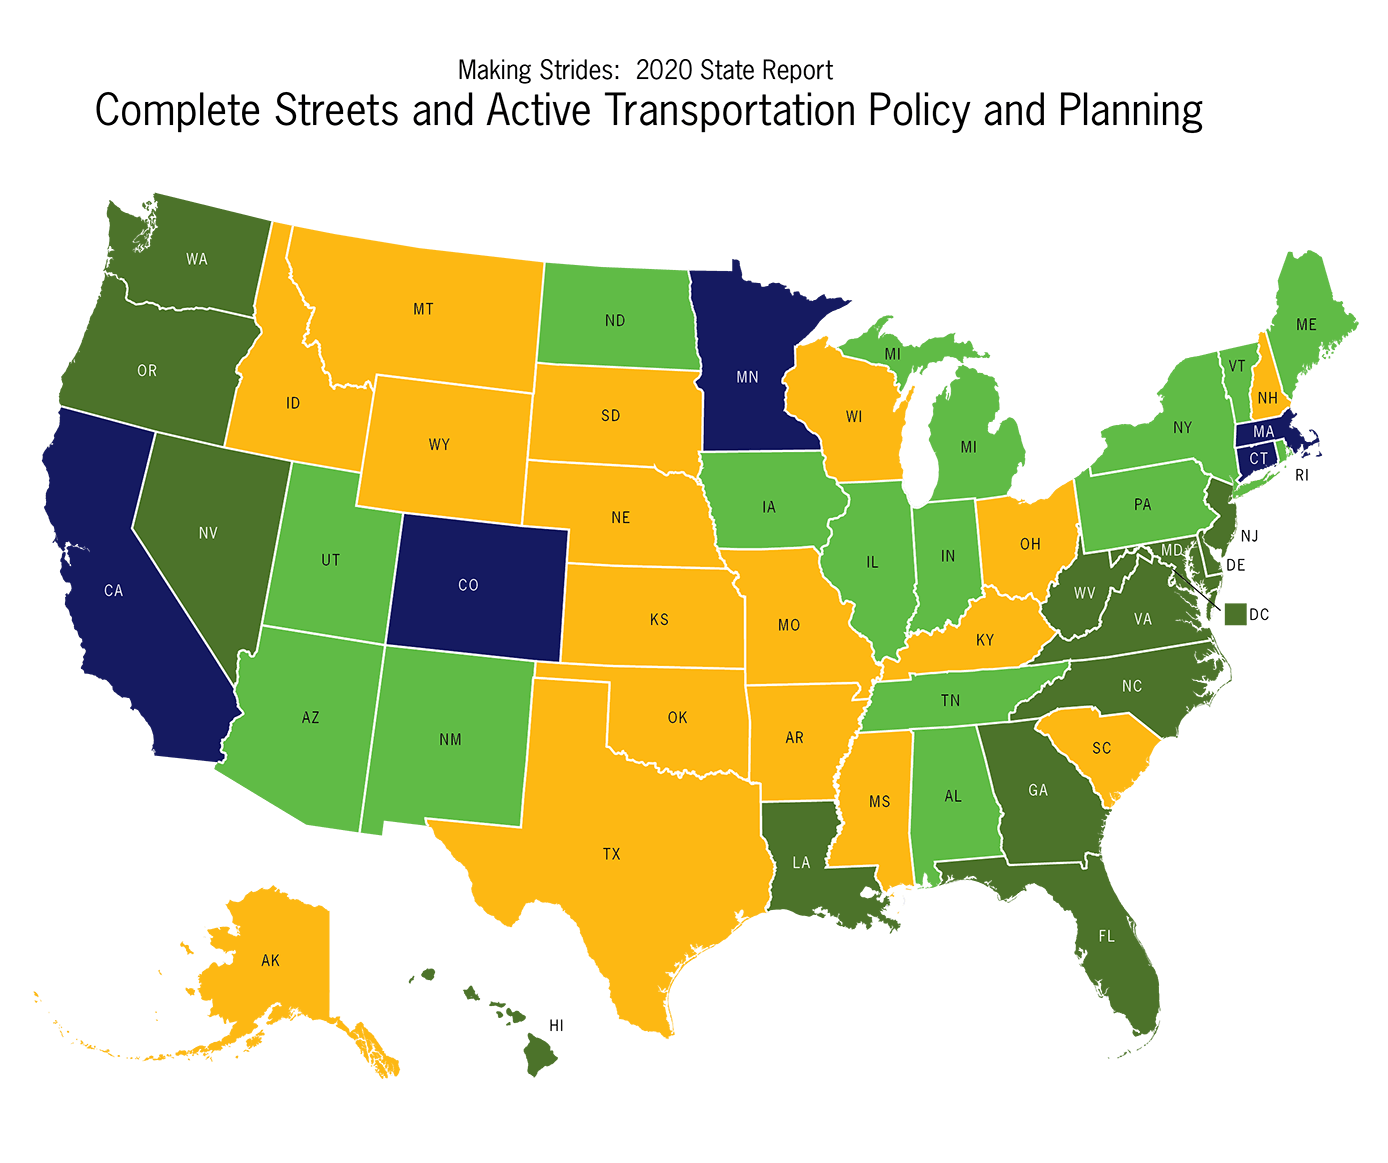
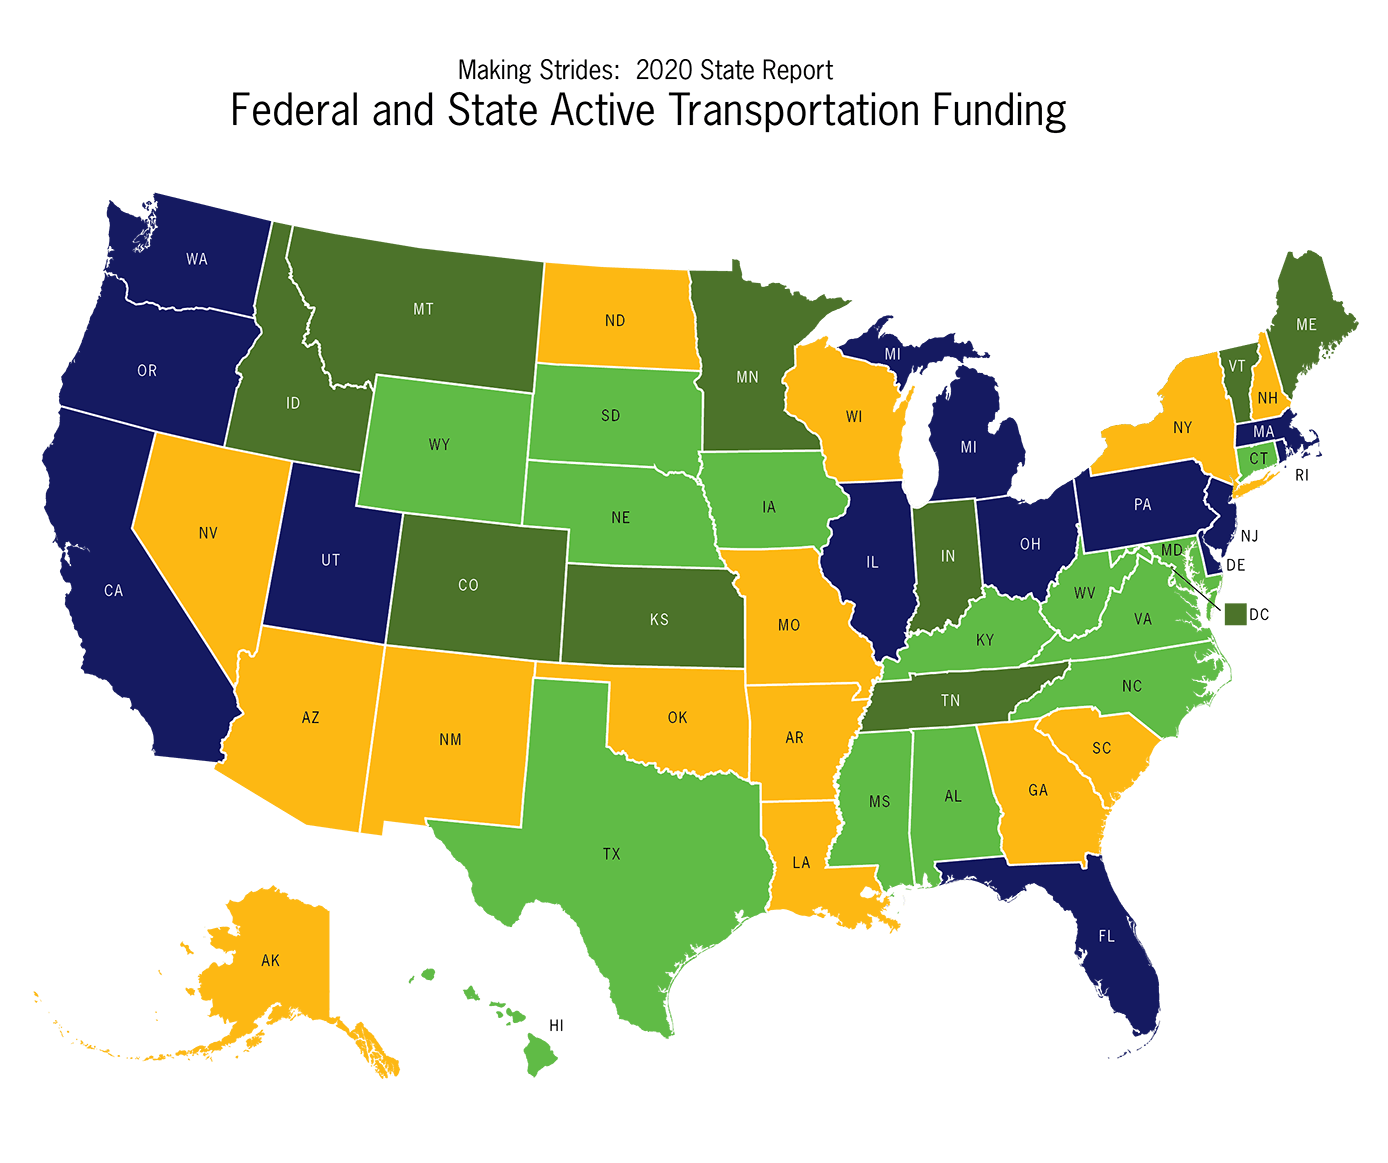
The report cards primarily look at state policy, focusing on four key areas: Complete Streets and Active Transportation Policy and Planning, Federal and State Active Transportation Funding, Safe Routes to School Funding and Supportive Practices, and Active Neighborhoods and Schools. Click on the map to view each state’s report card.
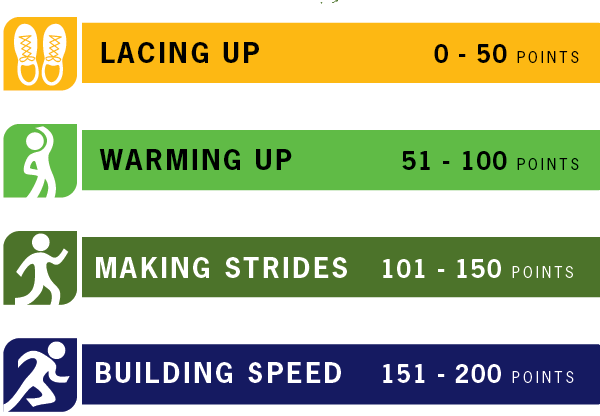
The full report includes a detailed explanation of how the states were graded. Download a quick guide to understanding the report card scores and grading and a fact sheet on how to use your state report card.
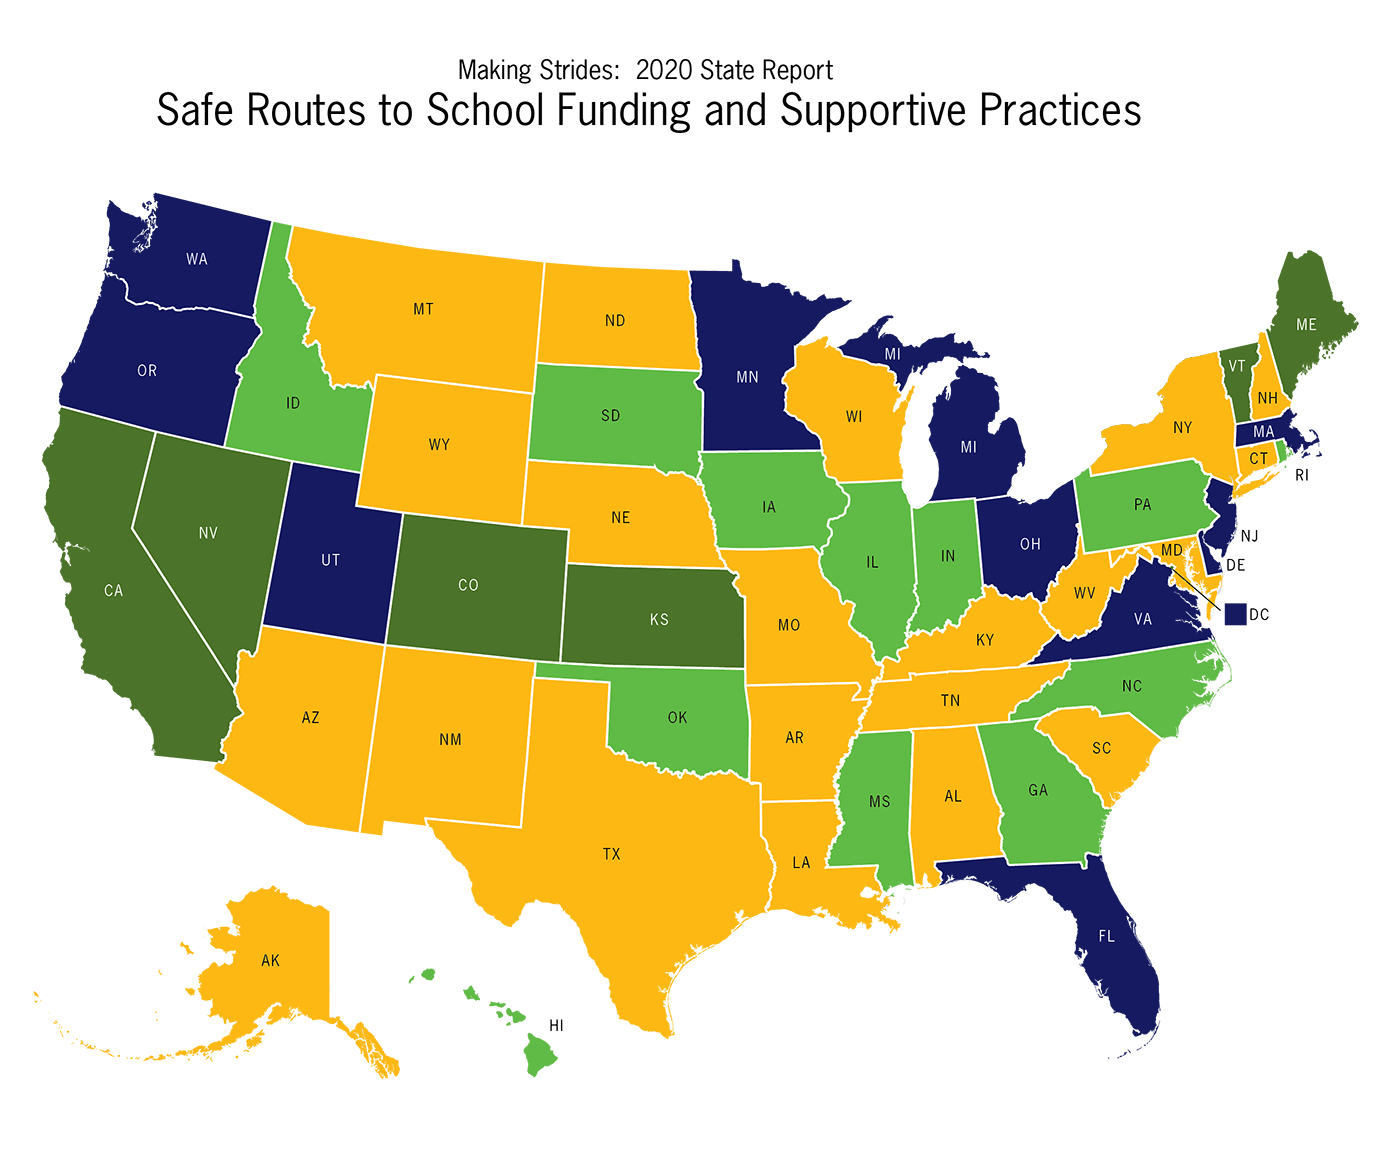
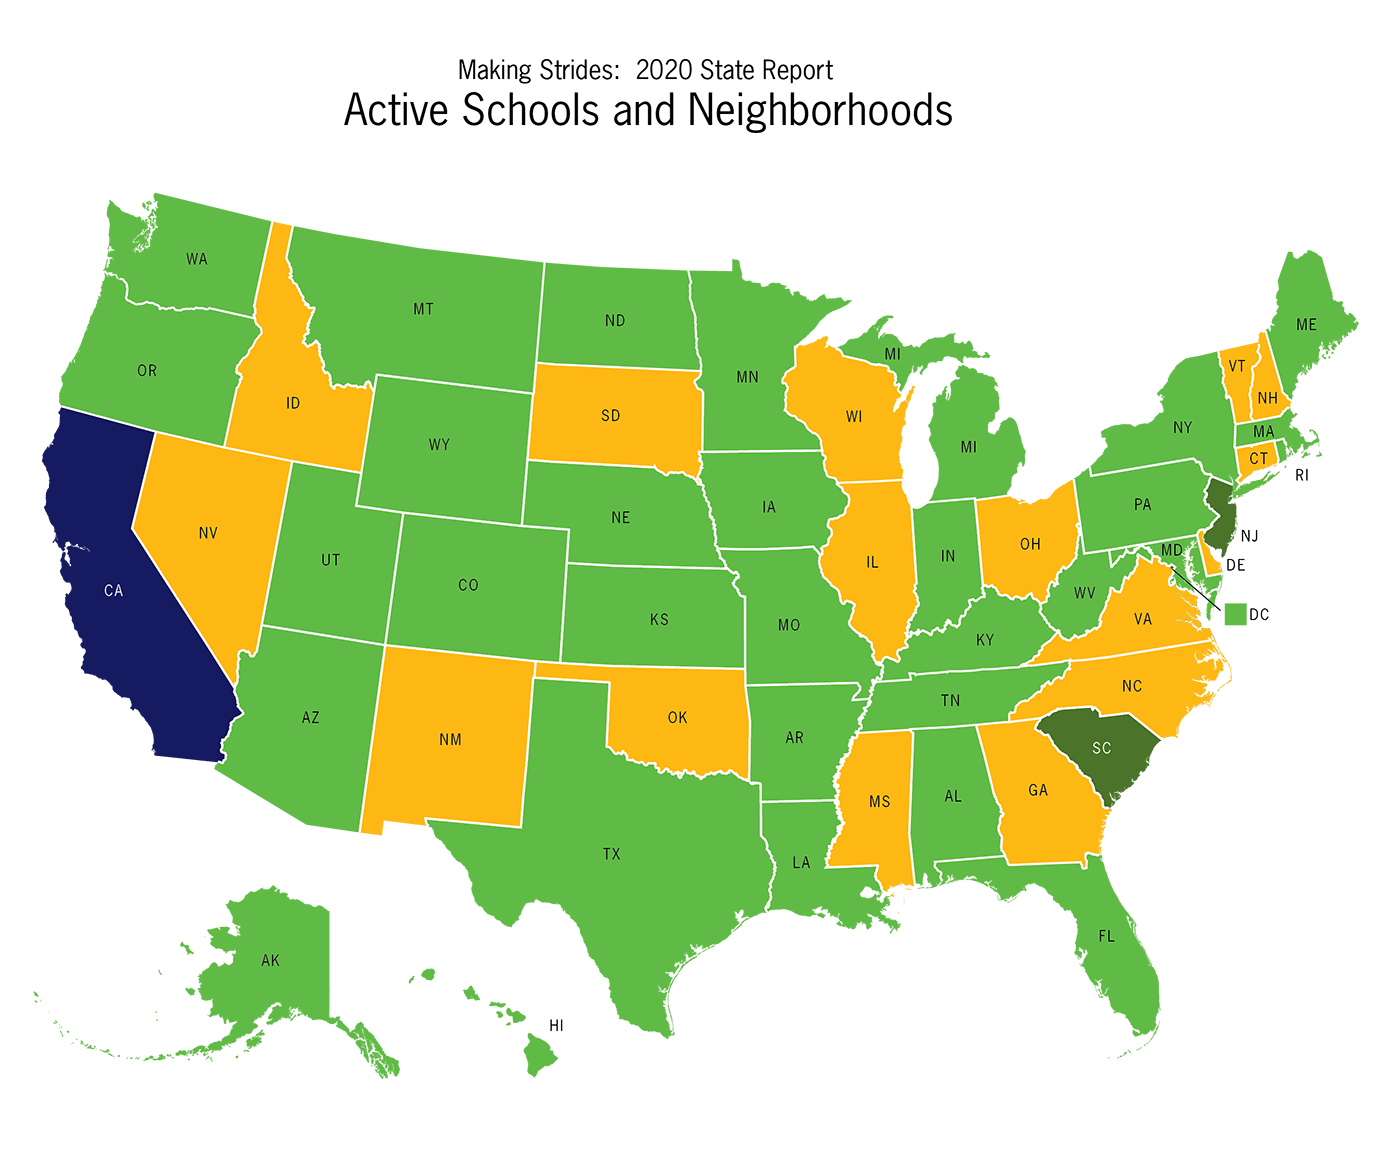
Overall scores for core topic areas:
Complete Streets and Active Transportation Policy and Planning | Federal and State Active Transportation Funding | Safe Routes to School Funding and Supportive Practices | Active Schools and Neighborhoods
The maps below show grades and information about key indicators for each state:
Complete Streets: Policy Type and Strength | Transportation Alternatives Program Funding Transfers | High Need Communities | State Funding for Active Transportation | Transportation Funding Grade | SRTS and Non-Infrastructure Funding | School Siting | Physical Education Requirements | Appendices



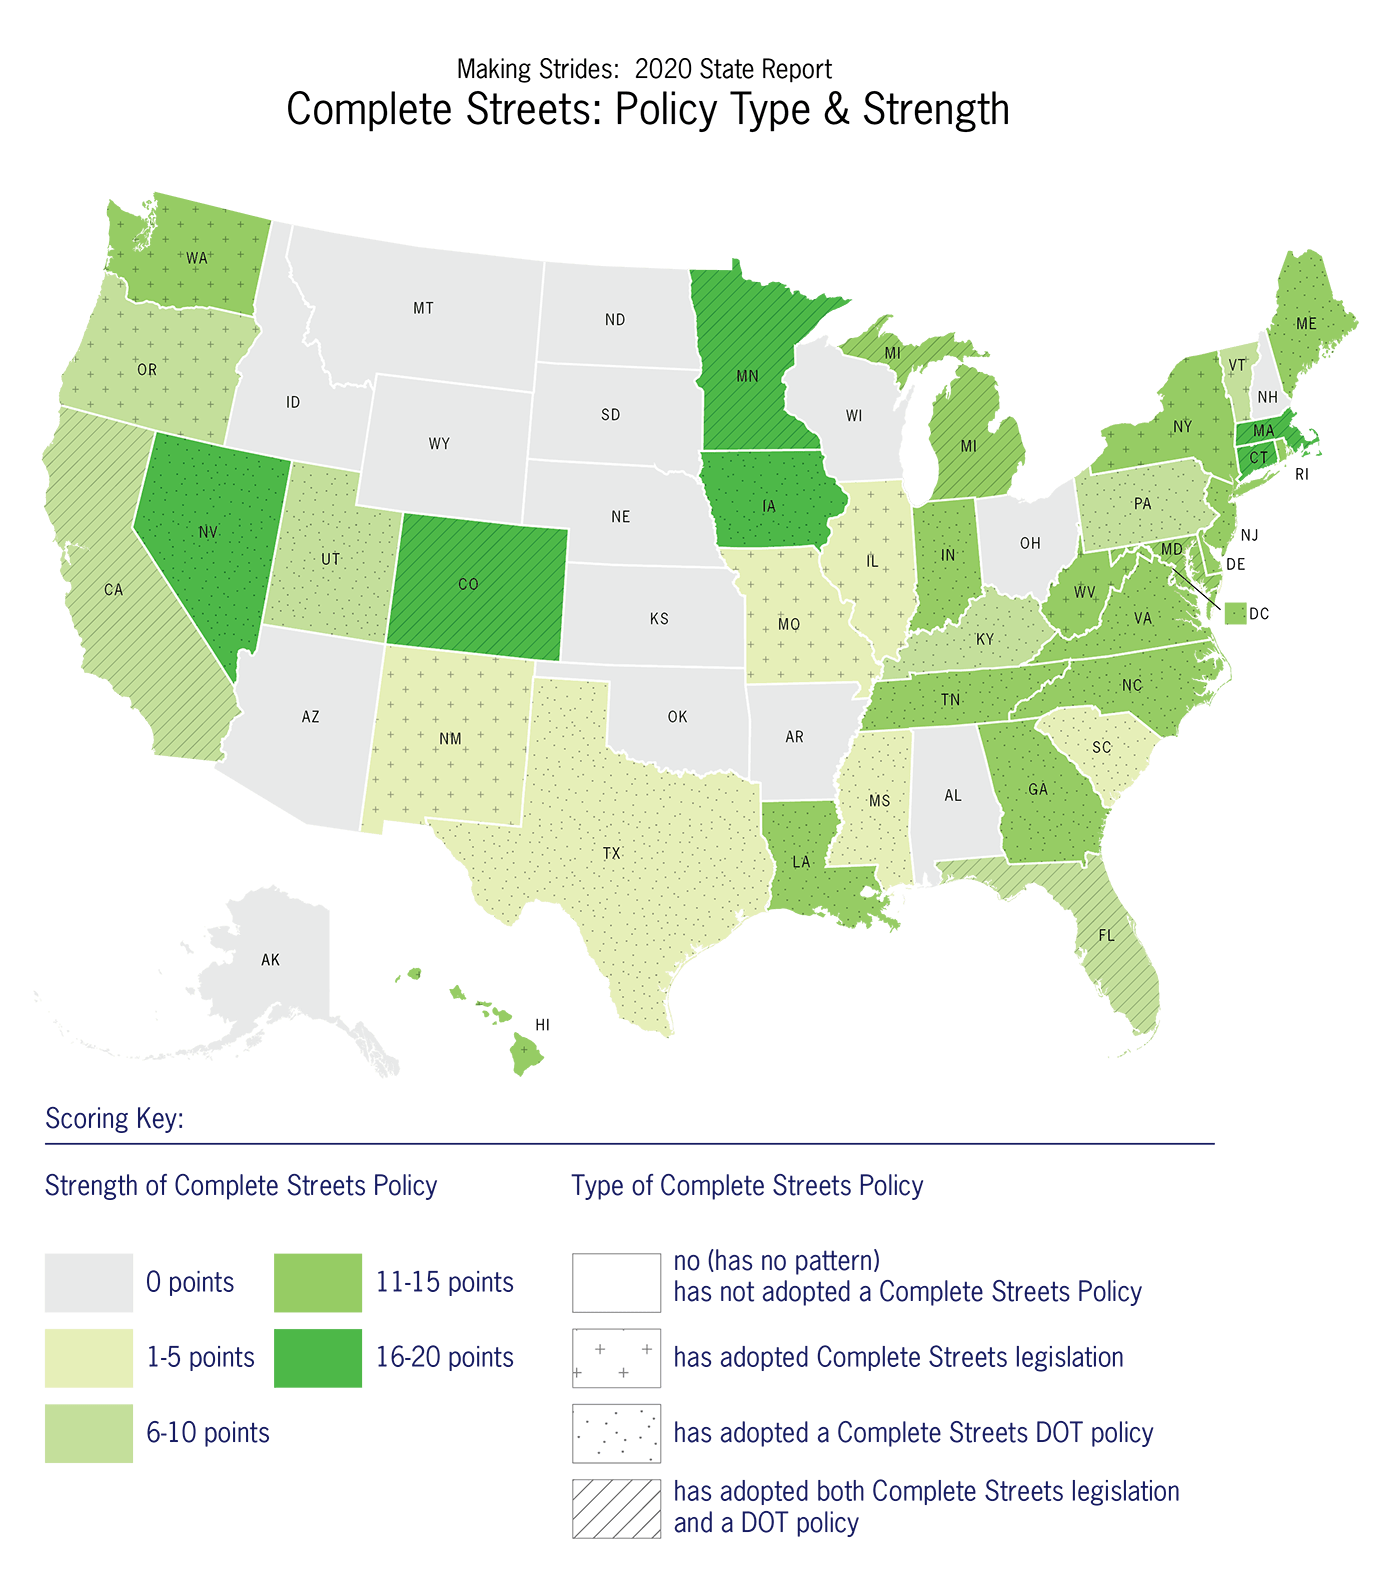
This map (figure 1 in the report) indicates what type of Complete Streets policy a state has adopted, if any, and how strong the state’s Complete Streets policy is according to the National Complete Streets Coalition’s analysis. Out of a possible 20 points, the average score for the strength of a state’s Complete Streets policy was under 11 points.

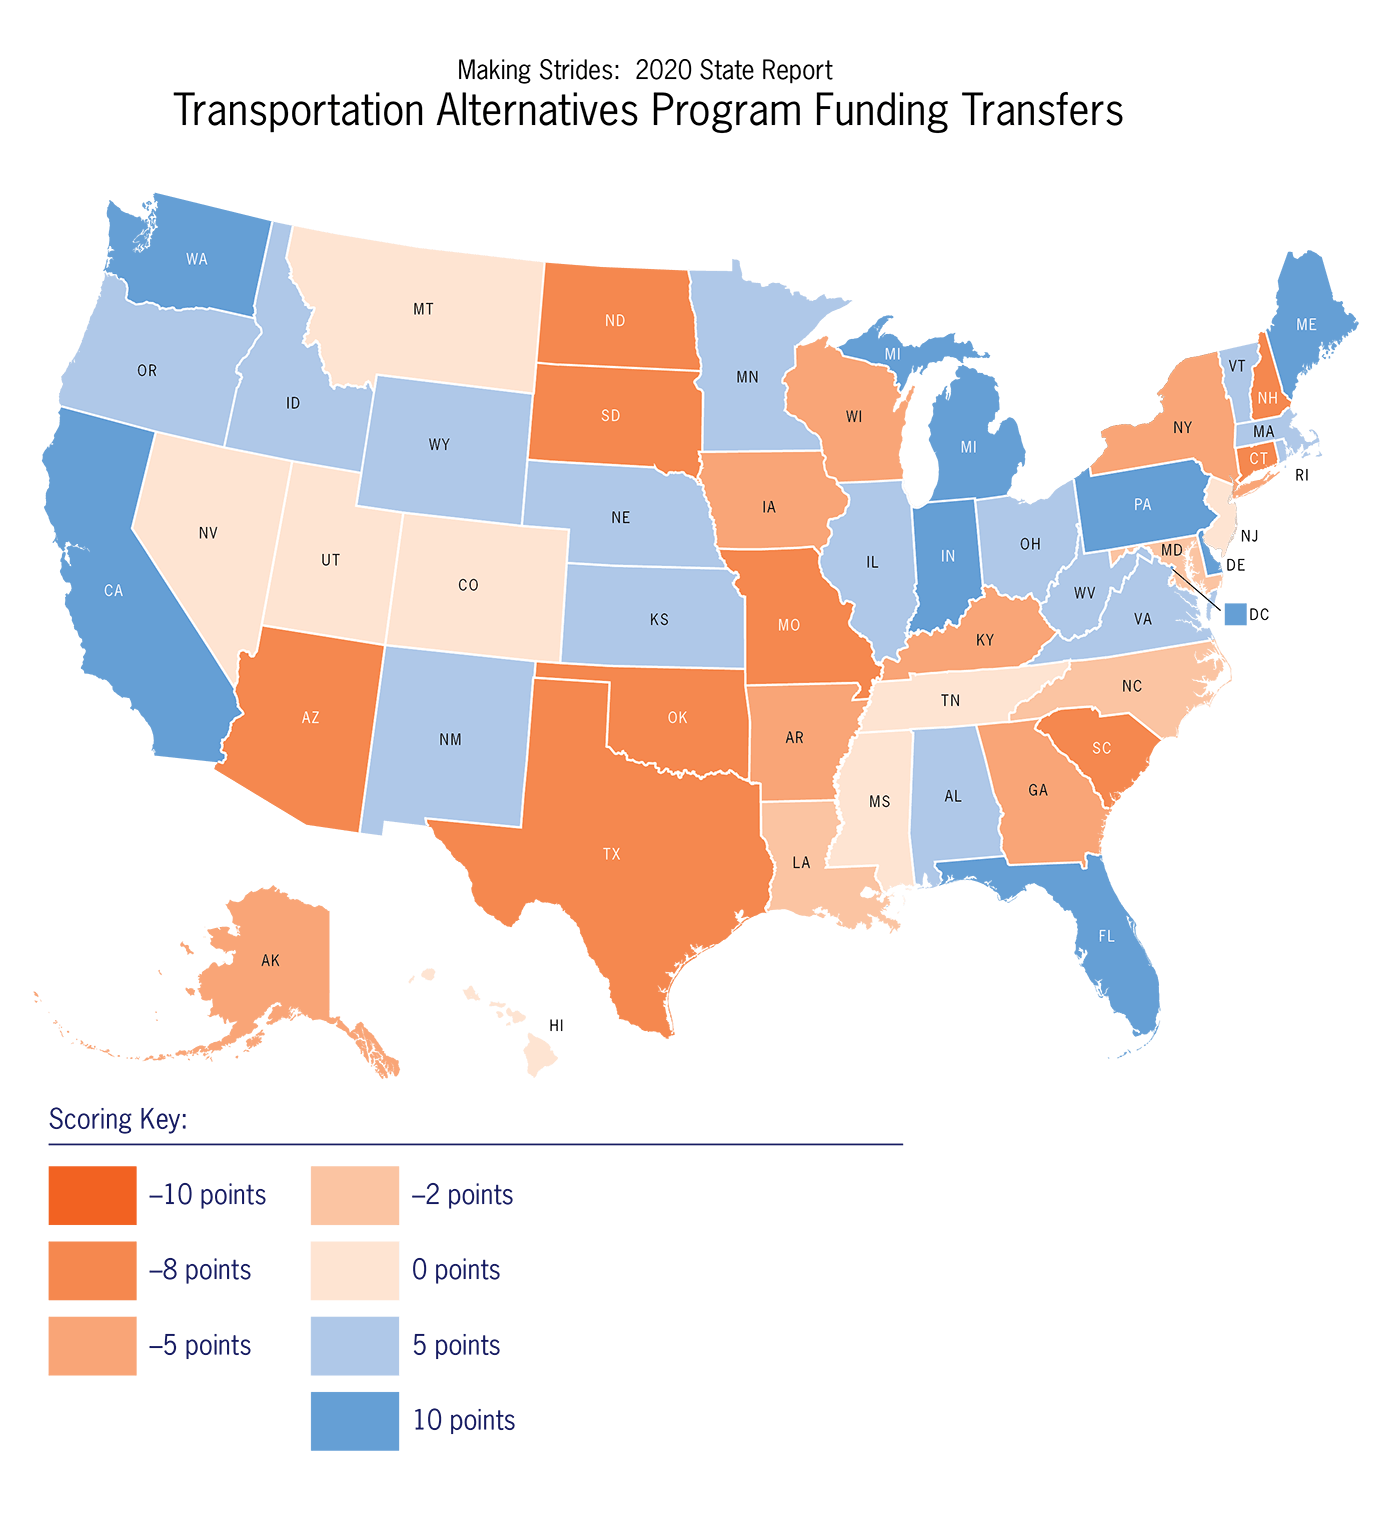
This map (figure 2 in the report) shows how states are doing in terms of amount of money transferred out of the federal Transportation Alternatives Program (TAP) funding received. Compared to 2018, more states are transferring funds away from TAP, shifting resources away from biking and walking and towards road and bridge projects. The number of states transferring less than 10 percent of TAP funding declined from 29 in 2018 to 24 in 2020, and states transferring 40 percent or more increased from 6 states in 2018 to 9 states in 2020.

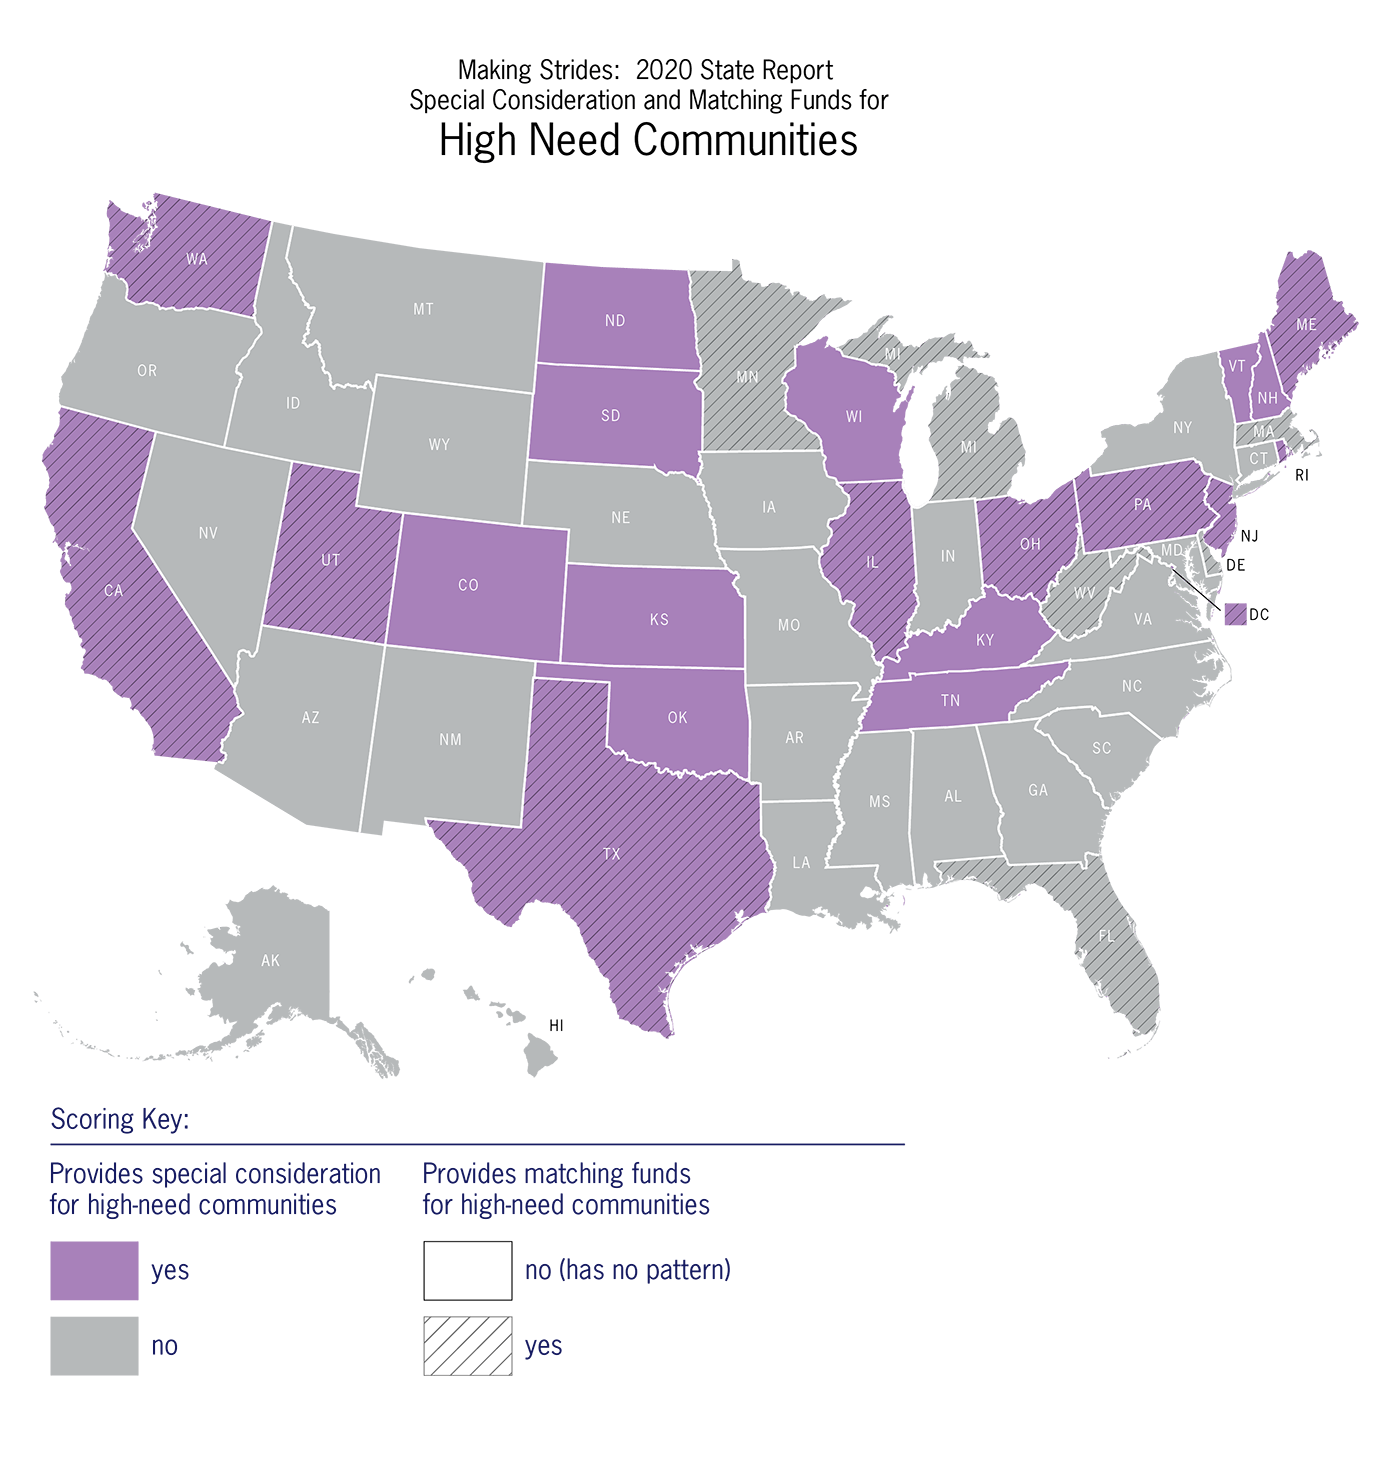
This map (figure 3 in the report) indicates whether states provide either special consideration and/or matching funds for high need communities in allocating TAP funding. Compared to 2018, states are making progress on prioritizing allocating TAP resources to those communities most in need. The number of states who utilize an equity consideration when awarding TAP projects grew from 16 in 2018 to 21 in 2020, and the number of states who provide matching funds for projects benefiting low-income communities grew from 13 in 2018 to 17 in 2020.

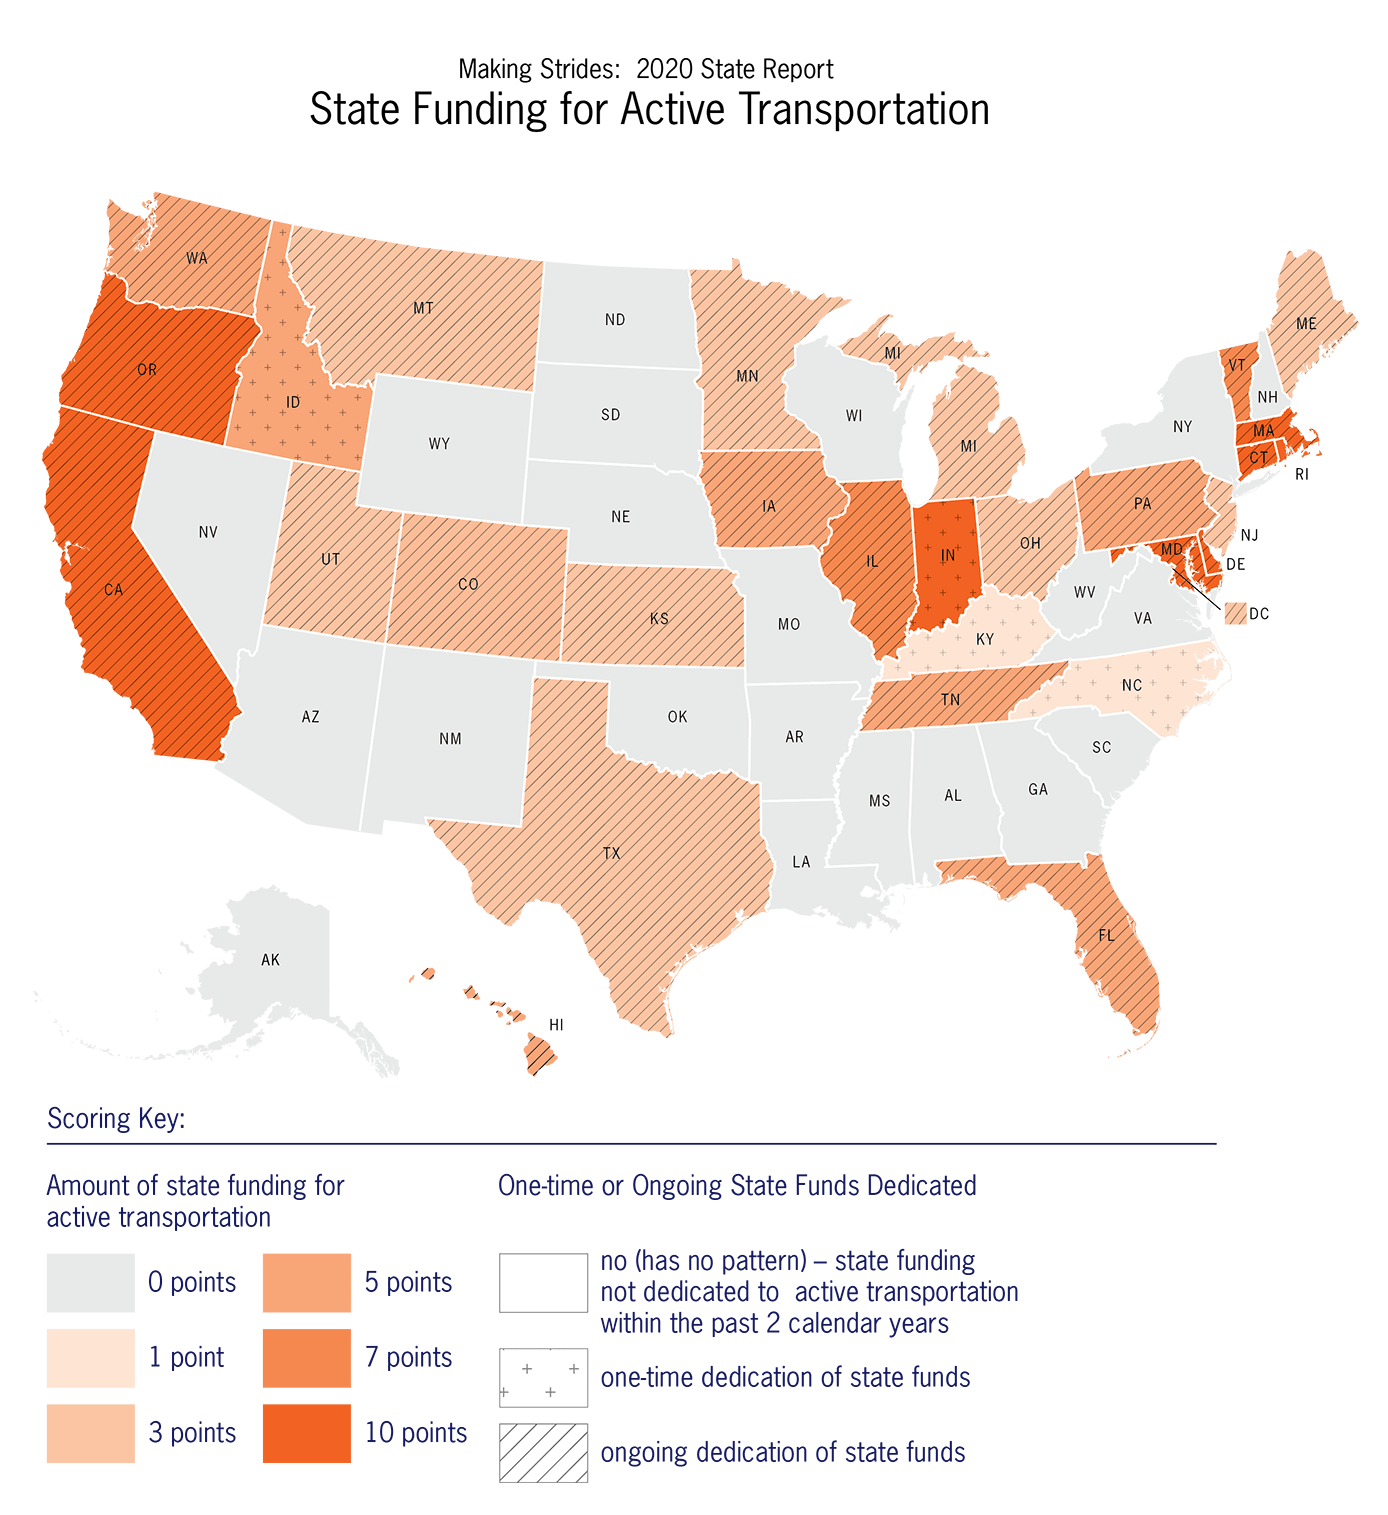
Including state funding for active transportation and Safe Routes to School as a new indicator for the 2020 Making Strides report cards provides a much-needed nationwide assessment/snapshot of how many states are paying for walking and bicycling out of their own coffers and how much state money is being spent on walking/biking. Overall, we were very pleased with the findings. Sixty percent of states are dedicating their own money for walking, biking, and/or Safe Routes to School.

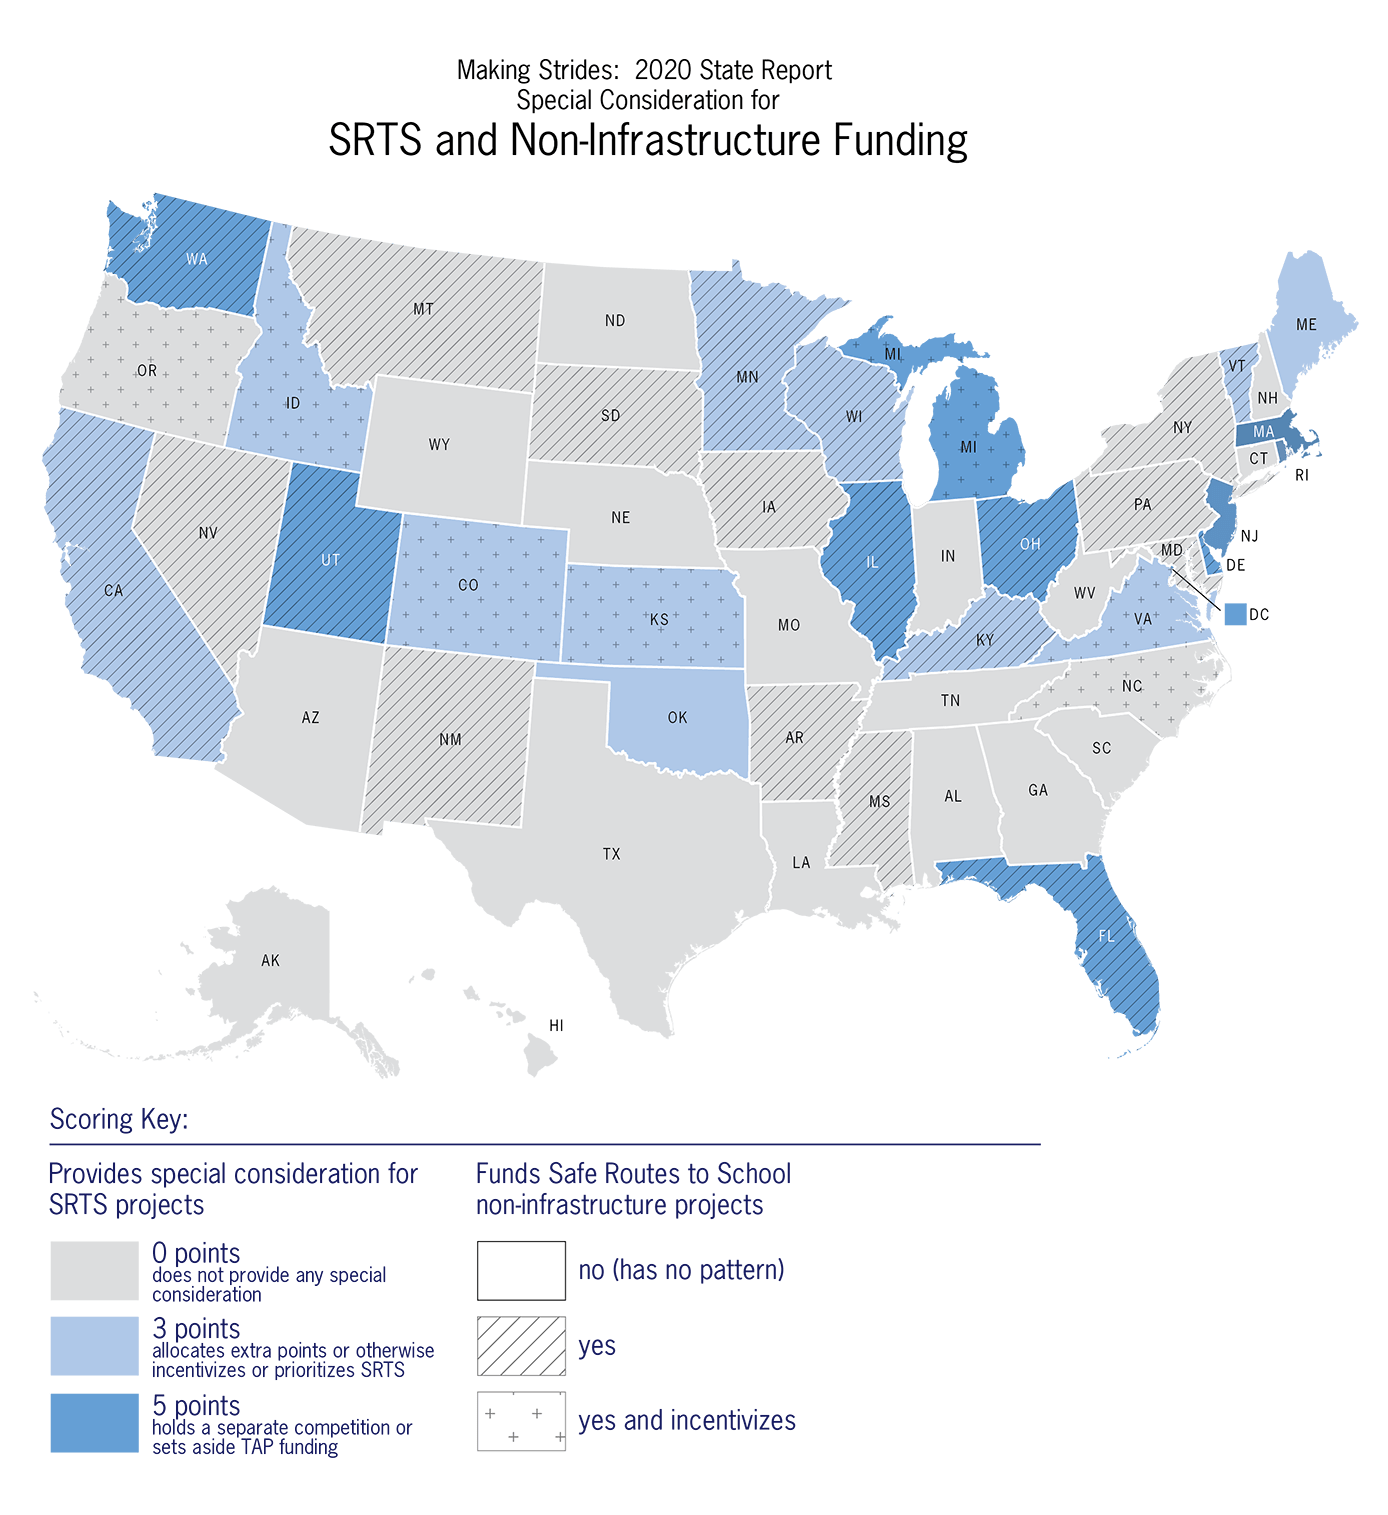
Compared to 2016 and 2018, more states are finding ways to prioritize or fund Safe Routes to School projects. Specific to the Transportation Alternatives Program, the number of states that either provide a scoring preference or set aside TAP funding specifically for Safe Routes to School projects has grown steadily from 17 in 2016 to 19 in 2018 to 22 in 2020. Unfortunately, a total of 23 states do not allow Safe Routes to School programming to compete for TAP funding, despite the fact that it is permitted by the federal law. This map (Figure 5 in the report) shows the degree to which states are providing special consideration for Safe Routes to School projects and/or funding non-infrastructure projects.

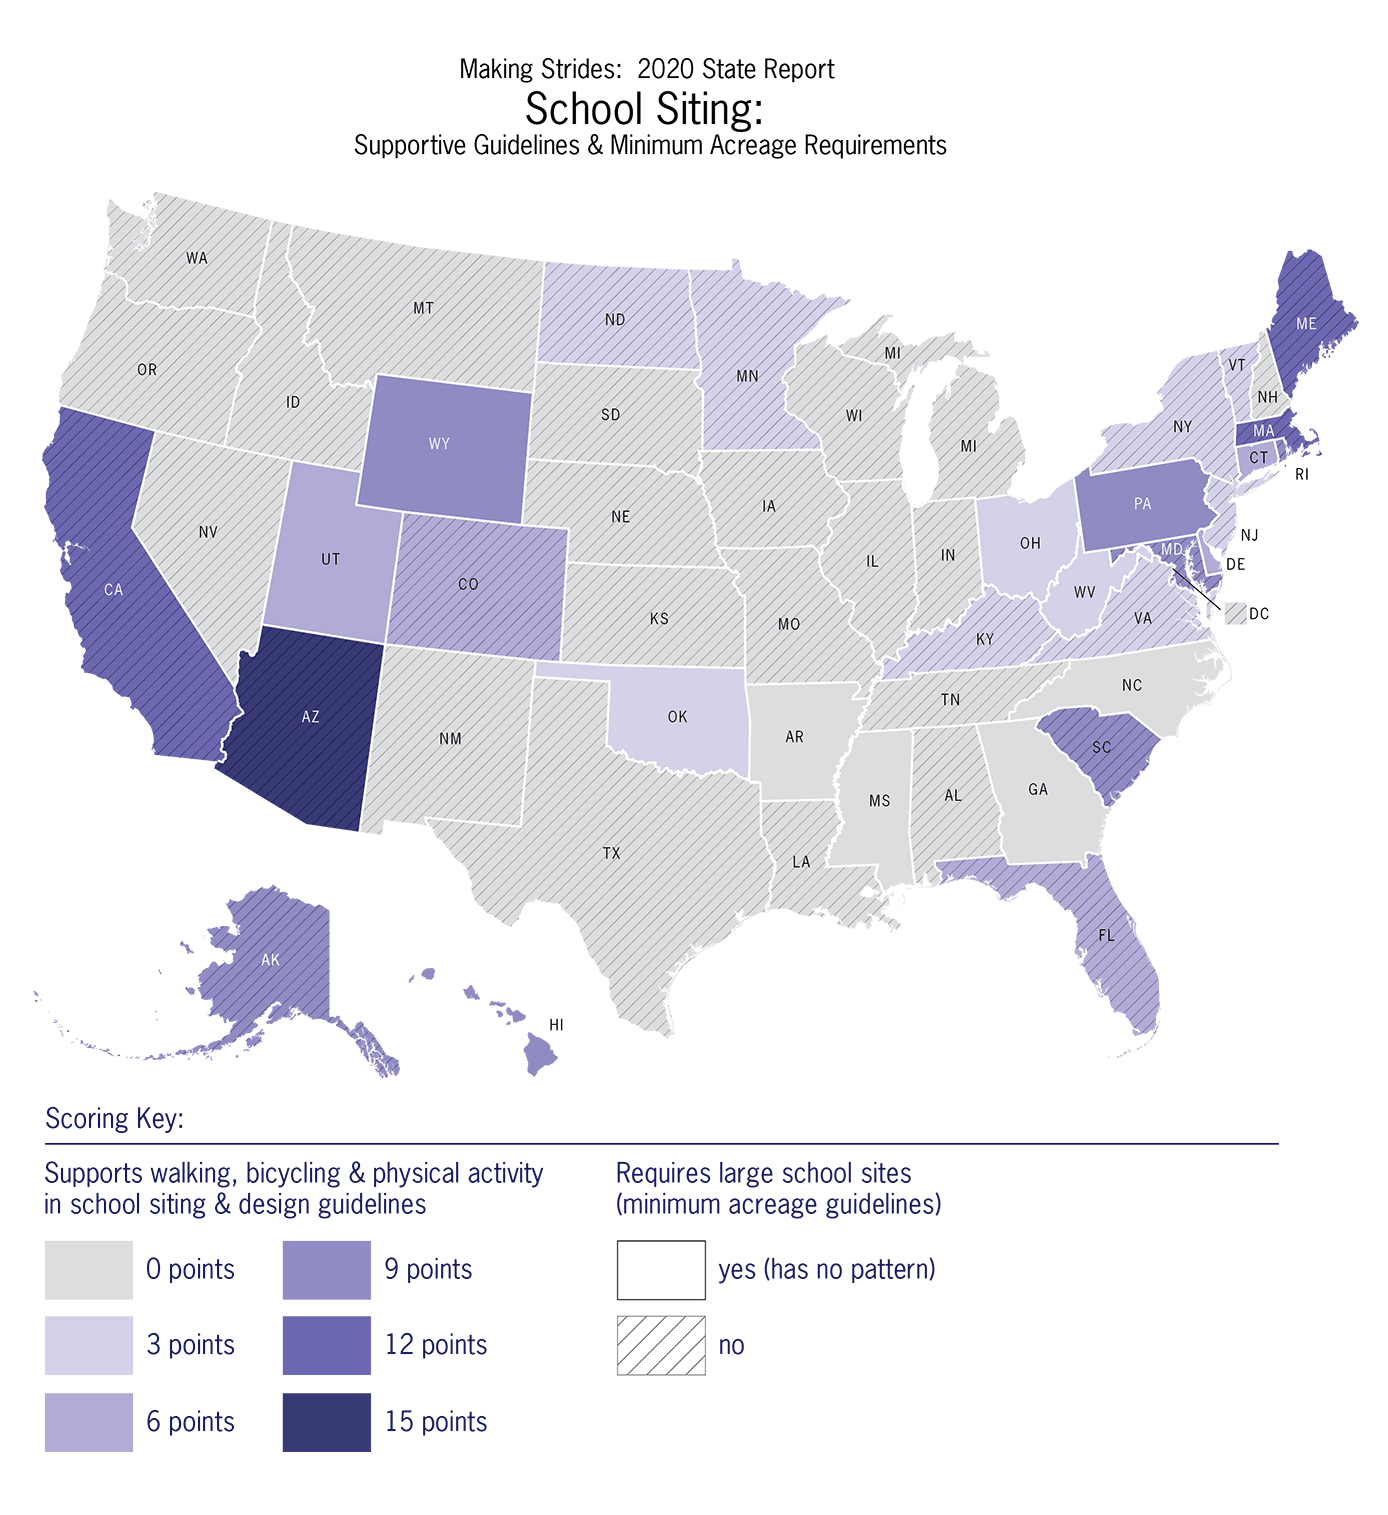
This map (Figure 6 in the report) indicates whether a state’s school siting guidelines are supportive of walking and bicycling to school. The number of states that include large acreage requirements in their school siting guidelines remains unchanged from 2018, and we regard this as a policy area where there is significant potential for additional state action.

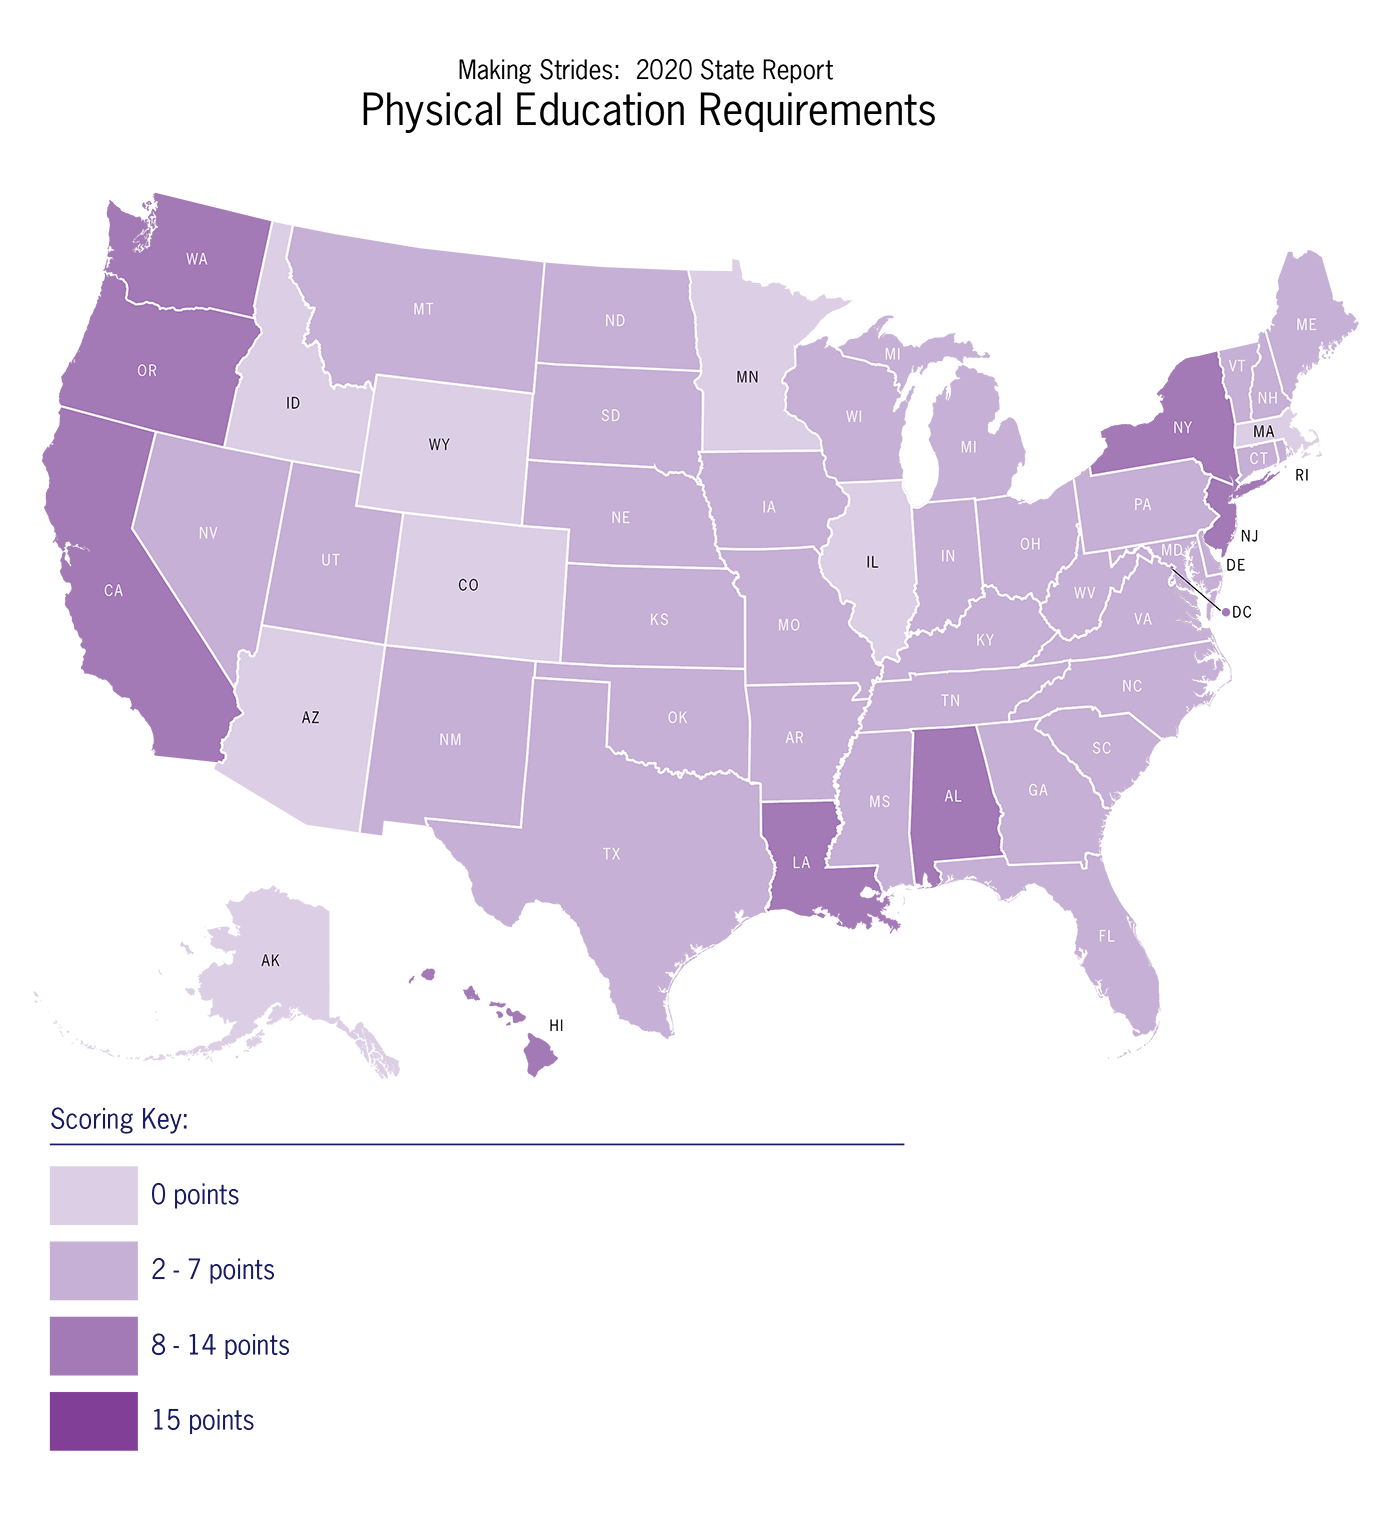
This map (Figure 7 in the report) shows how states scored in the Physical Education category. Points were assigned based on state regulations around the number of minutes of physical education for each grade range, as well as PE credits required for high school graduation. For elementary school children, seven states had such a requirement, and 19 states required some number of weekly minutes. For middle school youth, three states met the recommendation of 225 minutes per week, while 14 states had some requirement. In contrast, for high school students, although 41 states required some physical education credits for graduation, there was no state that required the recommended number of minutes, and only five states had a weekly PE requirement.


Tables in appendices of the report summarize scoring for each indicator in each of the core topic areas
by state.
- Appendix A summarizes scoring by state for the indicators in the Complete Streets and Active Transportation core topic area.
- Appendix B summarizes scoring by state for the indicators in the Federal and State Active Transportation Funding core topic area.
- Appendix C summarizes scoring by state for the indicators in the Safe Routes to School Funding and Supportive Practices core topic area.
- Appendix D summarizes scoring by state for the indicators in the Active Neighborhood and Schools core topic area.
- Appendix E summarizes the overall scores and grades by state in 2020.
- Appendix F summarizes minimum acreage requirements for schools at each grade level and each state’s correlating score.
- Appendix G summarizes state support for walking, biking, and physical activity in four key areas within school siting and design guidelines and each state’s correlating score.
